Facility Assessment Report Generator
A data-automation tool with documented QA, not a web app. Operator types a 6-digit CCN; the tool fetches three CMS datasets, validates every field against the official codebook, and produces a label-correct PDF / Word report. Built end-to-end in one day.
Overview
The visible thing is a small web app that takes a CCN and returns a PDF. The actual thing is a data-automation pipeline: three CMS datasets, joined on CCN + state, mapped to clean business labels, with documented QA at every step.
Medelite's INFINITE platform serves skilled-nursing facilities and currently produces facility assessment reports by hand — staff dig through CMS Care Compare, copy ratings and benchmarks, and assemble a report per facility. The task replaces "digging through separate databases" with one input (the facility's 6-digit CCN) and one output (a branded, label-correct PDF/Word report). The substance of the work is the data side: finding the right datasets, joining them correctly, translating CMS's verbose measure descriptions into clean report labels, verifying units, and reconciling cases where the live data disagrees with the sample PDF. The web app is the delivery vehicle; the QA discipline is what makes the output trustworthy.
Stack
The Problem
Compiling a facility assessment by hand means three browser tabs, one codebook, and dozens of judgment calls per report — each of which is a chance to mislabel a metric or report the wrong unit.
CMS publishes ~150 datasets through the Provider Data Catalog. Three of them together carry the data an INFINITE assessment needs (facility-level provider info, claims-based hospitalization/ED measures, national + state benchmark averages) — but they aren't pre-joined, the measure descriptions are verbose and easy to mis-shorten, the units differ between measures (some are percentages, others are per-1,000 long-stay resident-days), CCNs are leading-zero strings that get silently corrupted if treated as integers, and the sample PDF shipped with the brief actually disagrees with the live data in several cells.
Data Sourcing & Profiling
Three CMS datasets, three different shapes, all joined on federal_provider_number (CCN) + state. Discovering which datasets to use and how they're shaped was the first half of the work.
All data comes from the CMS Provider Data Catalog's datastore-query API:
https://data.cms.gov/provider-data/api/1/datastore/query/{datasetId}/0, filtered via the API's conditions parameter. Three datasets, three shapes:
| Dataset | ID | Shape | Used for |
|---|---|---|---|
| Provider Information | 4pq5-n9py |
one row per facility | Name, address, certified beds, four star ratings (overall, health inspection, staffing, quality of resident care) |
| Medicare Claims Quality Measures | ijh5-nb2v |
long, keyed by measure_code |
Facility hospitalization / ED scores — measure codes 521, 522, 551, 552 |
| State & US Averages | xcdc-v8bm |
wide, keyed by state_or_nation |
National + state benchmark rows — selected by the state_or_nation value (NATION vs. FL, etc.) |
Profiling the shape mattered. "Three CMS datasets" sounds simple; the real complexity is that each has a different schema convention. Claims is long-format (one row per measure per facility), Averages is wide-format (one row per geography with measure-named columns), Provider Info is one-row-per-facility. The join logic has to know which is which — and treating any of them as having the wrong shape silently produces the wrong report.
QA Methodology
Every label on the report traces back to a specific column in the NH_Data_Dictionary. No guessing, no copying from the sample PDF, no "looks right" judgments.
| Check | What I did & why |
|---|---|
| Codebook as source of truth | The NH_Data_Dictionary is the authoritative codebook, not the sample PDF shipped with the brief. Every report label maps back to a specific documented CMS column. The brief's sample PDF was treated as a layout reference, not a data reference — and when the two disagreed, the dictionary won. |
| Field-name cross-check | Each field name confirmed against the dictionary before being mapped. Measure codes 521 / 522 are percentages; 551 / 552 are per-1,000 long-stay resident-days. Formatted differently so they can't be silently mislabeled in the report. |
| Label translation (STR / LT) | CMS's verbose measure descriptions mapped to clean report labels: 521 → "Short Term Hospitalization", 522 → "STR ED Visit" (both resident_type = Short Stay); 551 → "LT Hospitalization", 552 → "LT ED Visit" (both resident_type = Long Stay). Confirmed against the claims dataset's resident_type field on live data, not assumed. |
| Correct value (risk-adjusted) | For each claims measure, used adjusted_score — the risk-adjusted value Care Compare itself displays — rather than observed or expected. Figures on the generated report match the official Care Compare page for the same facility. |
| CCN as string | CCNs are 6-character identifiers with possible leading zeros (Alabama's 015009 ≠ 15009). Treating them as integers anywhere — query param, JSON parsing, join key — corrupts the lookup. Strings end-to-end, validated as 6-digit. |
| Verification facility + boundary cases | Ran the full pipeline against the verification facility (CCN 686123 — Kendall Lakes Healthcare and Rehab Center, FL), checked the output value-by-value against live Care Compare, confirmed it generalizes on a facility in another state. Boundary cases: malformed CCN, valid-but-not-found CCN, leading-zero CCN, API failure — each surfaces a specific friendly error rather than crashing the layout. |
| Comparative interpretation | Facility vs. national vs. state with above/below-benchmark flagging — not just a value table. Two grouped bar charts (Chart.js) split short-stay (%) and long-stay (per-1,000) because the units differ; mixing them on one axis would mislead. |
Five QA points worth knowing
The QA depth above looks like checklists; here's the underlying data literacy each one represents — the five things an interviewer who knows the CMS data well would press on.
| Concept | Why it matters |
|---|---|
| 1. Observed vs. Expected vs. Adjusted Table 12 |
Each claims measure has three values: Observed (raw), Expected (case-mix prediction), and Adjusted (risk-adjusted). The report uses adjusted_score — the Care Compare display value. Risk adjustment matters so facilities with sicker residents aren't unfairly penalized. |
| 2. Footnote codes (suppression) Table 15 |
A blank metric isn't always "no data." The claims file has a footnote_for_score field. Code 1 = newly certified; code 7 = suppressed by CMS; code 9 = too few residents to report; code 10 = missing / not submitted. Report shows N/A for blanks — and treating blanks as 0 would silently corrupt the benchmark comparisons. |
| 3. CCN is a string with leading zeros Dictionary opening note |
CCNs preserve leading zeros (e.g. Alabama's 015009). Numeric parsing anywhere in the stack drops the zero and breaks the lookup. Validated as a 6-digit string at input. |
| 4. Units differ by measure | 521 / 522 are percentages; 551 / 552 are rates per 1,000 long-stay resident-days. Same shape on a chart axis would be wrong. The two grouped bar charts split short-stay vs. long-stay because they're not on the same scale. |
| 5. The report is a snapshot | Measures cover a window (e.g. 2024-10 to 2025-09) and carry a processing_date. The report footnotes that date so the reader knows what window the numbers represent — and reinforces why the brief's sample PDF disagreed with live data (different snapshot). |
Flow
From the operator typing 6 digits to a branded PDF/Word file landing in their downloads folder — seven discrete stages, each isolating a concern.
Architecture & Override Logic
Frontend, proxy, exports — kept deliberately small. The two design choices worth naming are the CORS workaround and the effectiveName() single-decision pattern.
| Layer | Choice | Why |
|---|---|---|
| Front-end | Vanilla HTML/JS | App is "fetch JSON → fill template → export file." No routing, auth, or client state machine. A framework would be overhead for one screen. |
| Styling | Tailwind CSS v3, compiled at build time | Real production build (npx tailwindcss --minify) ships ~15 KB of used CSS. Not the Play CDN (dev-only). |
| PDF export | jsPDF + jspdf-autotable | Fully client-side, direct browser download — no server render step. |
| Word export | docx v8.5.0 UMD | Real OOXML .docx built in-browser via Packer.toBlob. The .js UMD build deliberately — the newer .cjs build serves as application/node which nosniff browsers refuse to execute. |
| Charts | Chart.js 4.4.1 | Responsive grouped bars; loaded with a typeof Chart guard so the report still renders if the CDN is unreachable. |
| Proxy | Serverless /api/cms.js (Node 18+) | Required because of CORS — see below. |
| Hosting | Vercel | Runs the Tailwind build, serves public/, runs /api — one origin, free tier. |
The CORS workaround (what I actually did)
The CMS provider-data API is public but doesn't send an Access-Control-Allow-Origin header, so the browser blocks direct calls from the frontend. I confirmed it was server-side rather than a bug in my code — the request reaches CMS and returns data, but the browser won't expose it to the page because the permission header is absent (visible as a CORS error in the console and a missing header on the response).
I checked whether CMS's CORS-enabled data-api/v1 could avoid a proxy, but the Care Compare datasets I needed aren't published there. So I added a small serverless proxy: the browser calls my own /api/cms endpoint, which fetches CMS server-side and returns the JSON — same origin, so CORS no longer applies — and I restricted it to only the CMS datastore path the app uses.
Tradeoff: the app can no longer be deployed as a purely static site on something like GitHub Pages — it needs a host that supports serverless functions, such as Vercel. This still keeps the architecture simple, keeps everything in a single repository, still runs on a free tier, and avoids depending on public third-party CORS proxies that can be unreliable or disappear over time.
Override logic: effectiveName()
Medelite frequently uses localized internal names rather than the legal name CMS returns. The override flow is built around one helper function whose only job is to decide which name to use.
- By default the report shows the official facility name from the CMS API (
provider_name). An optional override text field accepts a user-typed custom name. effectiveName()checks the override field first: if the user typed something, return that; otherwise fall back toprovider_name. The decision lives in one function rather than being repeated wherever the name appears.- The facility name shows up in four places: the on-screen report, the PDF, the Word document, and the download filename. All four call
effectiveName(), so they can never disagree and there's a single place to change the rule. - The override only ever feeds the "Name of Facility" field. The "INFINITE — Managed by Medelite" banner is rendered separately and hard-coded, so a custom facility name can never overwrite the corporate branding.
Assumptions
Where the brief was ambiguous or self-contradictory, I picked the defensible interpretation and documented it.
- Kendall Lakes sample PDF treated as layout reference, not data fixture. CMS refreshes these datasets, so live values now differ from the sample (live Overall = 5, sample = 1). I render live data verified against the
NH_Data_Dictionaryrather than the stale numbers in the sample. - Facility name defaults to
provider_name, notlegal_business_name. The sample report matchesprovider_name;legal_business_nameadds", LLC"and looks wrong for the operational use case. - Current Census pre-fills with
average_number_of_residents_per_dayas a sensible default — operator overrides if they have a more current number. - Blank metric →
N/A, not 0. A blank can mean suppression (footnote codes 1/7/9/10), not "the value is zero." Treating it as 0 would silently corrupt benchmark comparisons.
Findings
Live, deployed, end-to-end in one day. CCN 686123 (Kendall Lakes Healthcare and Rehab Center, FL) is the verification facility — value-by-value reconciled against Care Compare and the dictionary.
1. The on-screen report
Facility identity, four star ratings, all 12 hospitalization/ED metrics with national + state benchmarks, and two grouped bar charts (short-stay % vs long-stay per 1,000). Manual operational inputs (EMR, current census, type of patient, previous coverage, etc.) layer on top of the CMS-fetched skeleton.
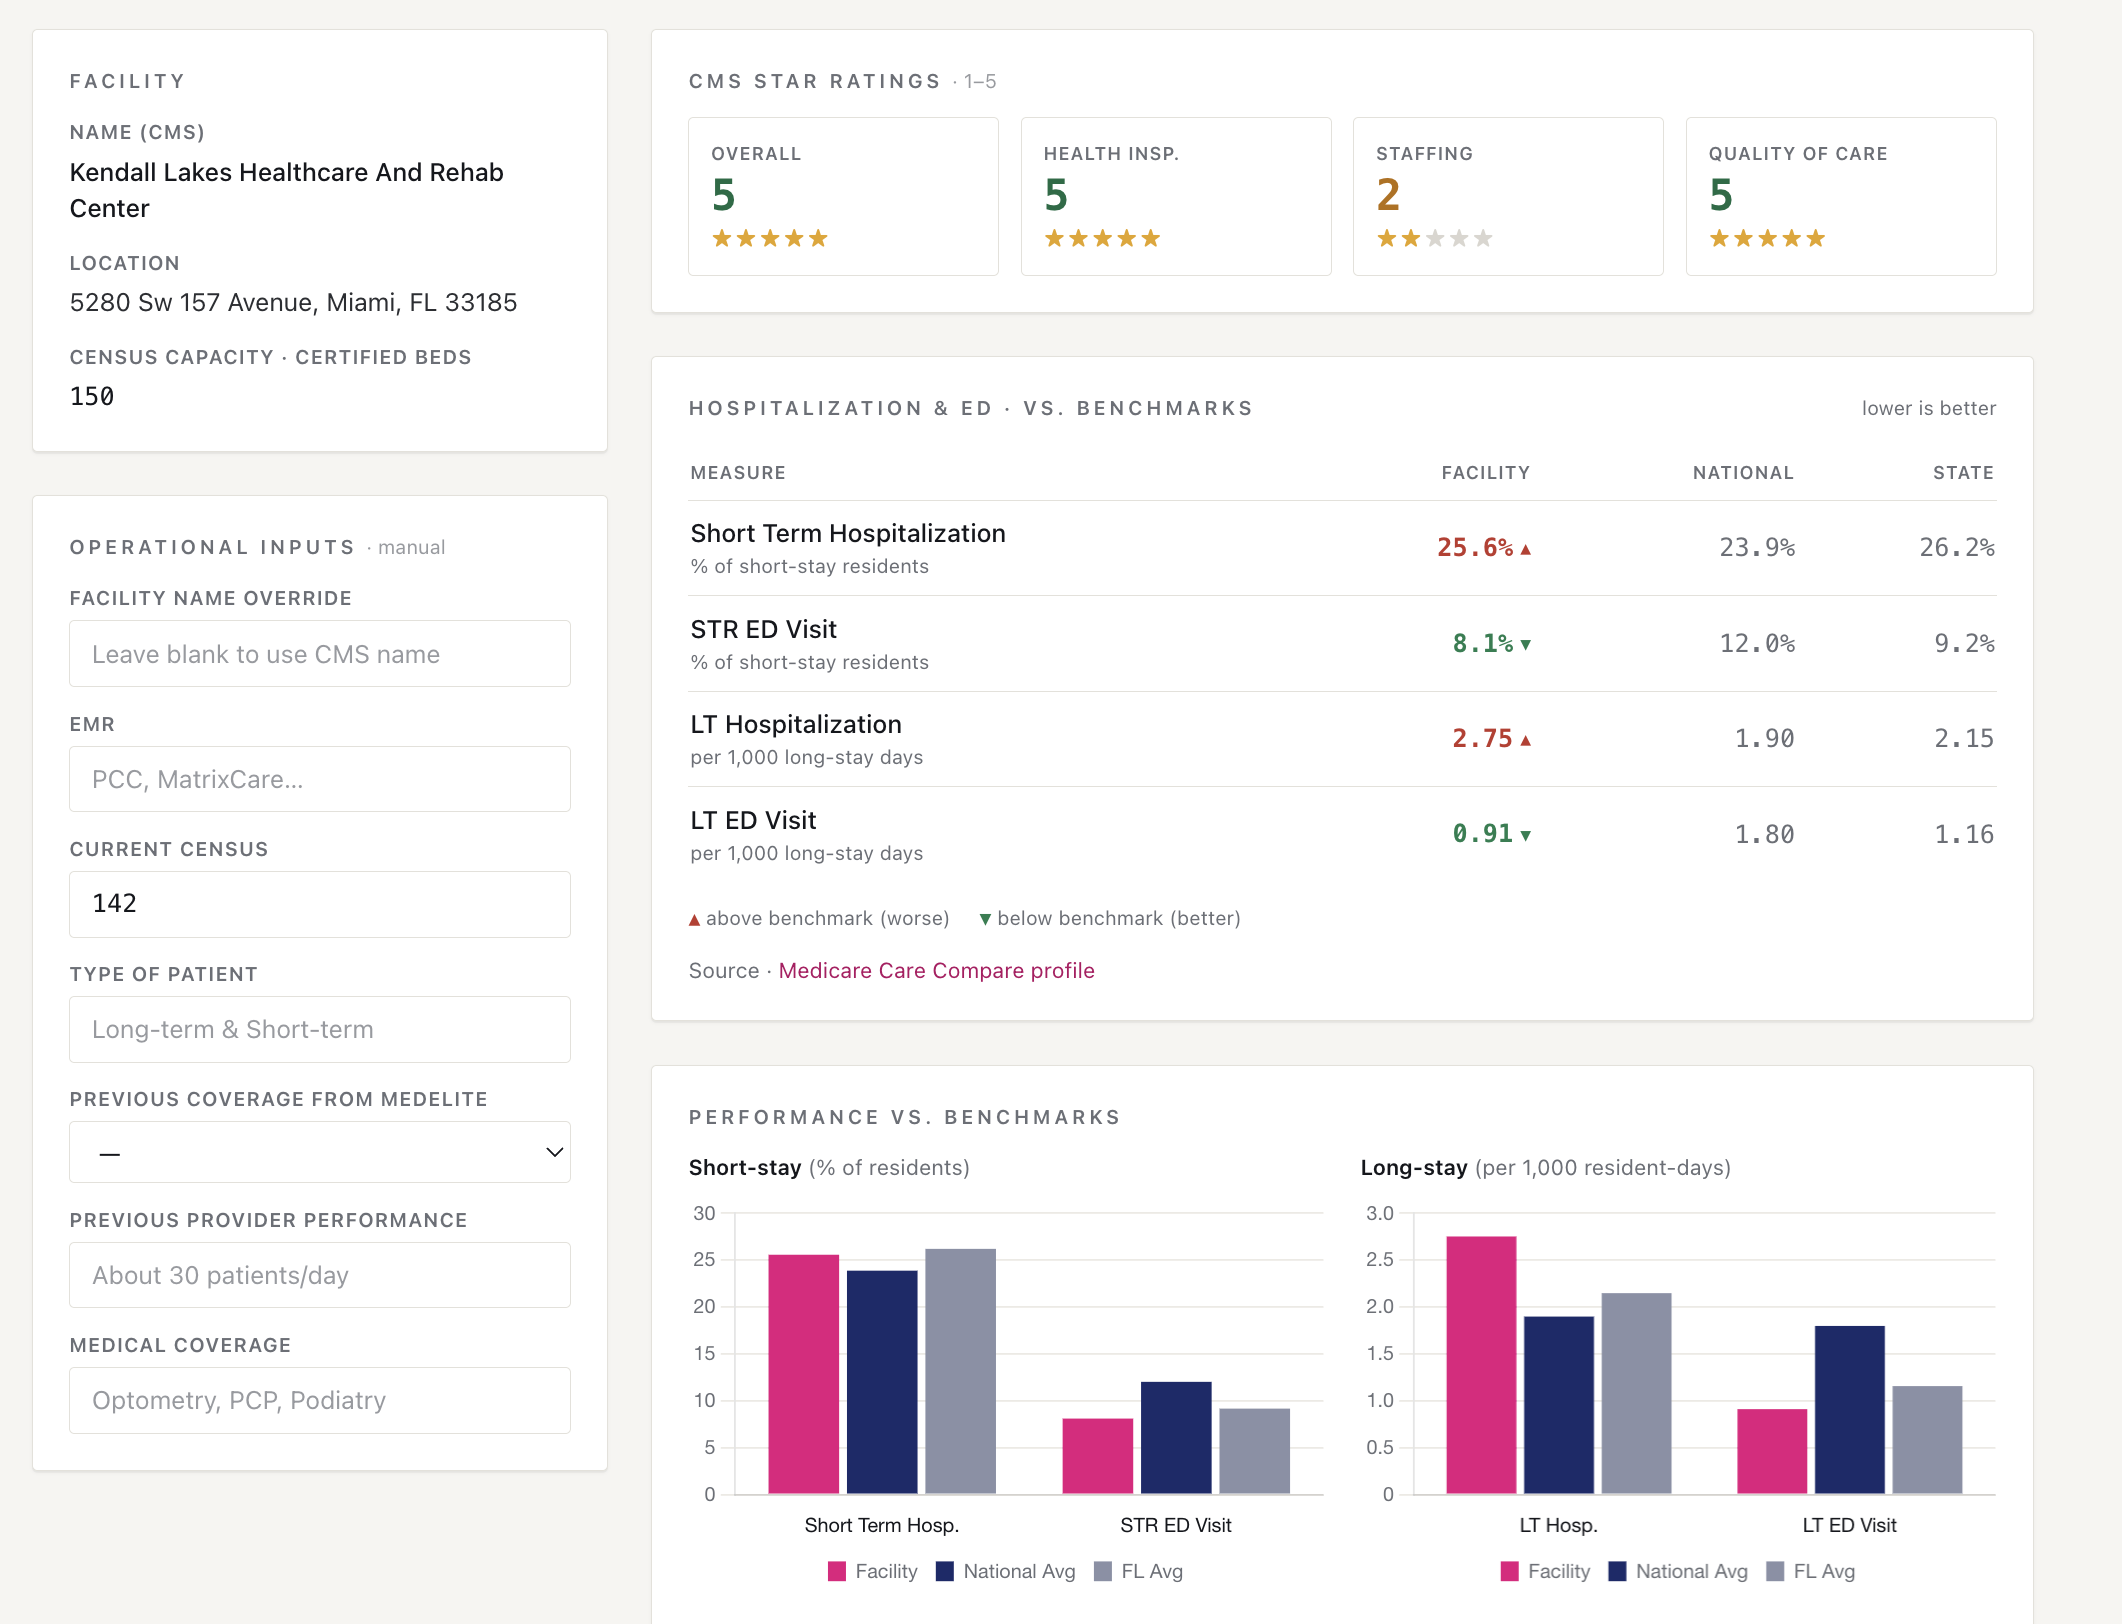
686123 — facility identity, four star ratings, hospitalization & ED metrics with benchmark flags, two grouped bar charts (short-stay % vs long-stay per 1,000).2. The exported report (PDF / Word)
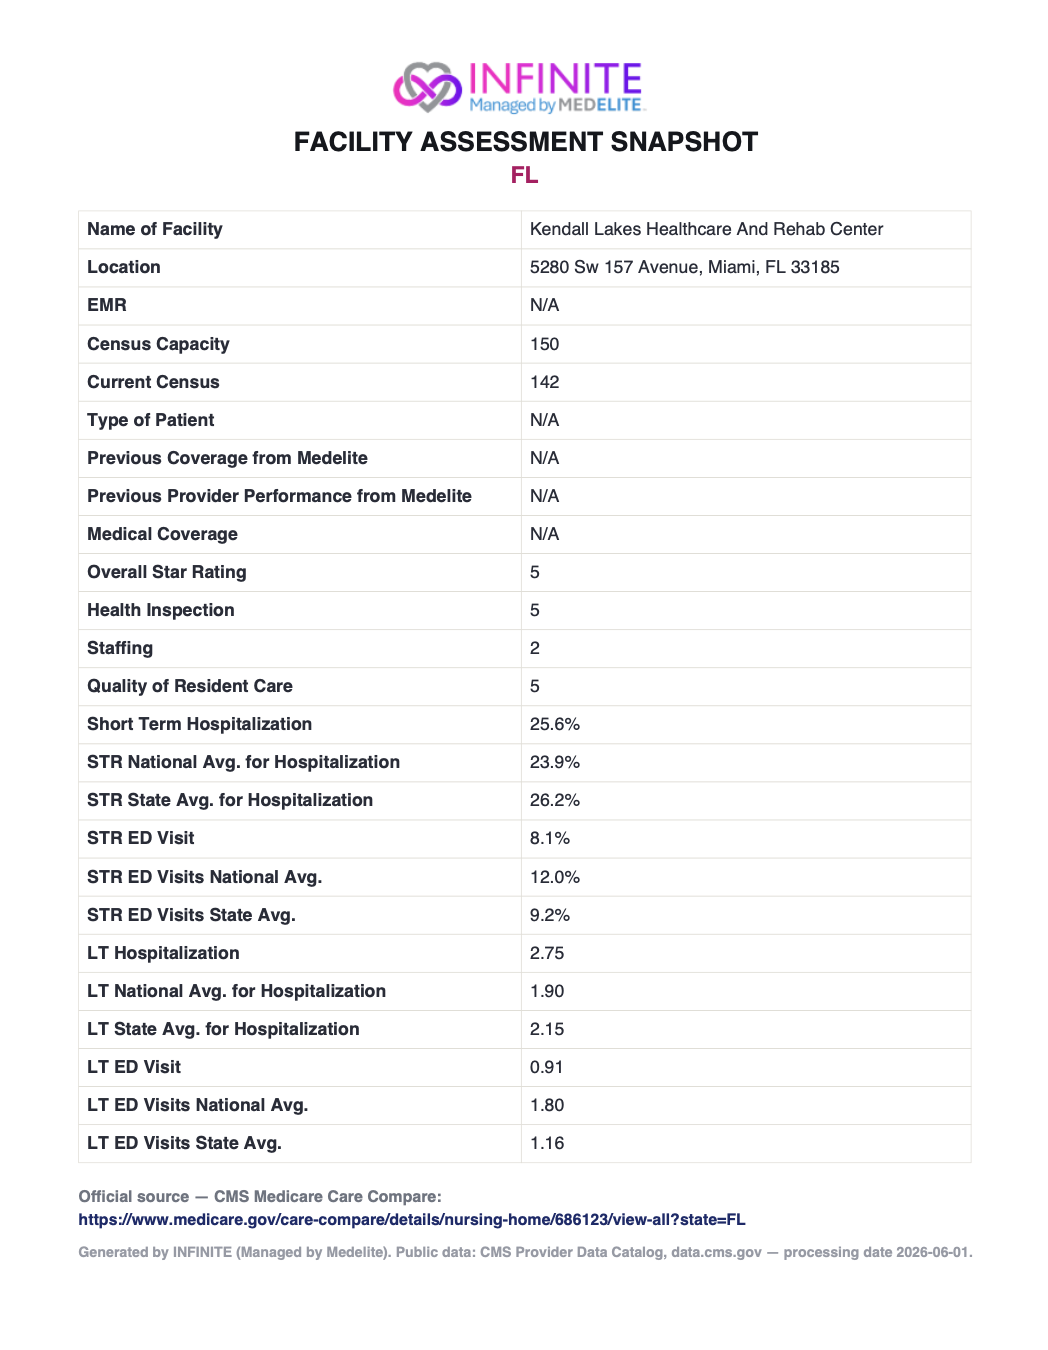
One-click PDF and Word exports with consistent branded layout. Every field traces back to a documented CMS column via the dictionary. The Care Compare source link is built dynamically from the CCN so the reader can click through to verify any number.
Lessons Learned
On a take-home where the role is Data Automation & QA Analytics, the JS choices matter less than the QA discipline. Leading with the data narrative — and being honest about how the code got written — is more role-aligned than over-engineering the front-end.
What worked. Treating the dictionary as the source of truth. Every label on the report traces back to a documented CMS column, every unit is verified, every footnote code is handled rather than silently rounded to zero. That's what makes the report trustworthy and the methodology repeatable on a different facility, in a different state, on a different day.
What I'd do differently. Ship a separate QA_VALIDATION.md artifact next to the README — a written record per field: source dataset, dictionary reference, unit check, edge cases handled (suppression / missing / leading zeros), and the value-by-value reconciliation against the verification CCN. That single document reframes the whole project from "a web app" to "a data-automation tool with documented QA," and it's the most role-aligned thing the submission could include.
On AI assistance. I used an AI coding assistant to move the front-end implementation faster — the proxy, jsPDF wiring, Tailwind setup. The decisions on scope, architecture, dataset selection, label mapping, unit verification, and QA strategy are mine. The assistant saved time on the JS plumbing; it didn't make the calls about what counts as "validated" or which CMS column maps to which report label. I'd rather state that plainly than disguise it.