Korean Price Monitor
A data engineering pipeline that asks whether Korea's official CPI captures what people actually pay.
Overview
Two government APIs publish Korean consumer price data in different formats at different frequencies. This pipeline joins them, validates the data quality of every run, and answers a single question: when official CPI says inflation is X%, is that what consumers are actually paying?
I noticed grocery bills weren't tracking with the official inflation numbers and wanted to know whether my impression held at scale. Statistics Korea (KOSTAT) publishes product-level e-commerce prices weekly in XML — ~600K product listings per collection across 124 item categories. The Bank of Korea (ECOS) publishes monthly CPI indices in JSON, with 1,743 hierarchical items keyed to a base year of 2020. They share classification codes, which means the comparison is possible — but neither source produces a joined view, neither is robust against the other's schema drift, and neither validates its own freshness or completeness. The pipeline handles all of that: defensive API integration, raw-data preservation, six quality checks with thresholds calibrated against real distributions, and a 4-page Streamlit dashboard that produces the "Price vs. CPI" view that started the question.
Stack
The Problem
The official inflation index and the prices in front of consumers come from the same government but don't talk to each other.
Korean consumer price data is published by two agencies in incompatible formats. KOSTAT publishes the granular reality — actual e-commerce prices, product by product, ~600K listings per collection cycle — in XML, weekly, with a ~2-week lag. ECOS publishes the official inflation summary — CPI indices, 1,743 categories, base year 2020 — in JSON, monthly. The two sources share classification codes, so the comparison is technically possible: for any given category, you could check whether product prices are tracking the official CPI or drifting from it. But nobody had built that joined view, and crucially, nobody was validating that either source had returned good data on any given run. KOSTAT in particular has undocumented API behaviors — successful responses omit the result code that the documentation says is always present, item codes are 6 characters where docs say 7 — which means a naive pipeline silently produces garbage on a bad day.
Architecture
Eight Architecture Decision Records — every major choice has its rationale in the repo. The discipline of writing them down on a solo project was overkill; doing it anyway kept the pipeline coherent.
| ADR | Decision | Rationale |
|---|---|---|
| ADR-001 | KOSTAT + ECOS over KAMIS | KAMIS required company registration. KOSTAT turned out to have richer data — individual product listings vs. aggregated. |
| ADR-002 | PostgreSQL via Docker over DuckDB/SQLite | Need partitioned tables, concurrent writes during collection, and durable raw storage. Docker keeps the dev environment portable. |
| ADR-003 | Store raw, aggregate later | Re-aggregation should be possible without re-fetching. Raw stays untouched; SQL transforms produce the mart. |
| ADR-004 | Cron + Python over Airflow | Two sources on weekly/monthly cycles. Airflow's orchestration complexity doesn't justify the maintenance overhead at this scale. |
| ADR-005 | Pre-build API verification step | The first thing the pipeline should do on a new endpoint is print what it returns. Costs nothing; prevents a class of silent failures. |
| ADR-006 | Defensive KOSTAT parsing | API docs lie. Successful responses omit the result code; item codes are 6 chars where docs say 7. Parser written against actual behavior, not docs. |
| ADR-007 | Quality thresholds calibrated against real distributions | Initial CPI range [80, 130] (from "CPI ≈ 100") produced 143 false positives. Real sub-indices range 47–211. Widened to [30, 250] after looking at the data. |
| ADR-008 | Streamlit over Grafana | The dashboard's job is analytical insight (Price vs. CPI overlays), not infra monitoring. Streamlit is the right tool for that. |
Pipeline
Two collectors hit the source APIs on independent schedules. Schema drift is checked first, raw data lands unaggregated in Postgres, quality is validated, and a separate SQL stage produces the analytical marts.
Quality checks (every threshold justified)
| Check | Threshold | Rationale |
|---|---|---|
| KOSTAT freshness | > 21 days → WARN | Weekly updates + 2-week lag; 21 days = 1 missed cycle. |
| ECOS freshness | > 45 days → WARN | Monthly updates; 45 days = 1 missed cycle. |
| Item completeness | < 90% → WARN | Some missing items per date is normal; < 90% is systematic. |
| Null sale_price | > 10% → WARN | Products should always have prices; high nulls = parsing issue. |
| ECOS CPI range | outside [30, 250] → WARN | Sub-indices legitimately range widely. Calibrated after [80,130] produced 143 false positives. |
| Price anomalies | change > 2× IQR → WARN | IQR-based; robust to non-normal distributions. |
Repo structure
Dashboard
A 4-page Streamlit dashboard: Price Trends, Price vs. CPI (the original question), Data Quality Health, and Pipeline Ops.
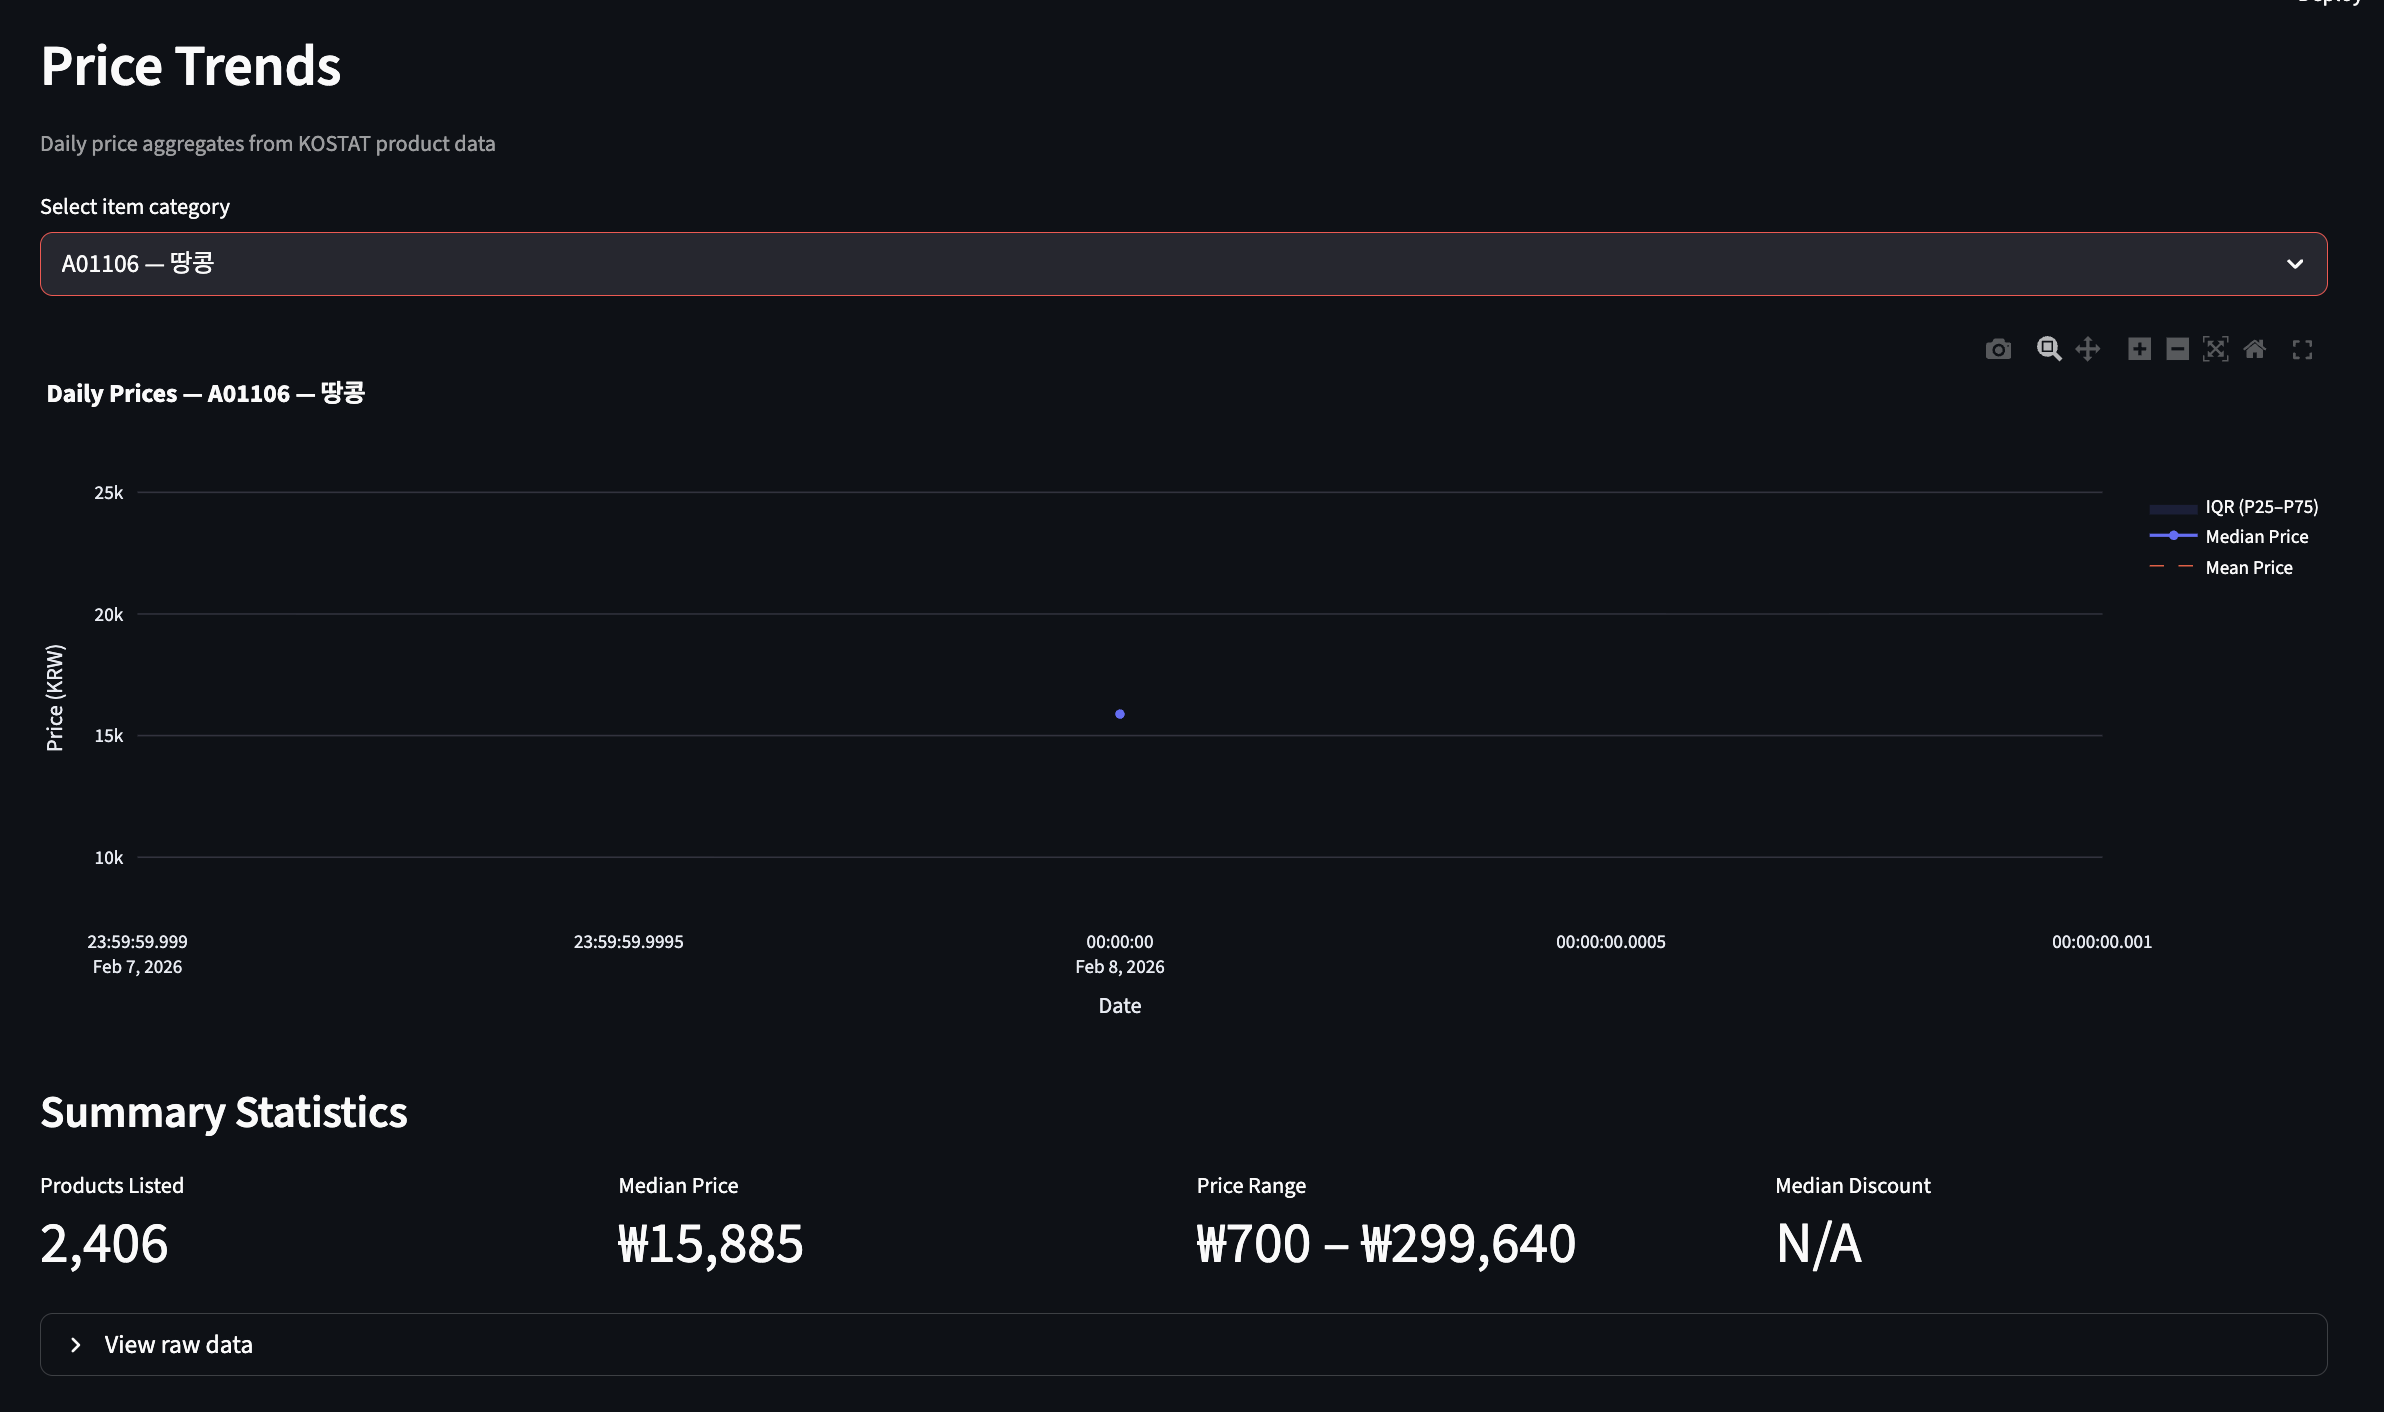
1. Price Trends
For any of the 124 product categories, time series of median price (blue) with IQR band (shaded) and mean price (dashed red). When median and mean diverge, a small set of expensive or cheap products is pulling the average away from what most consumers actually pay.
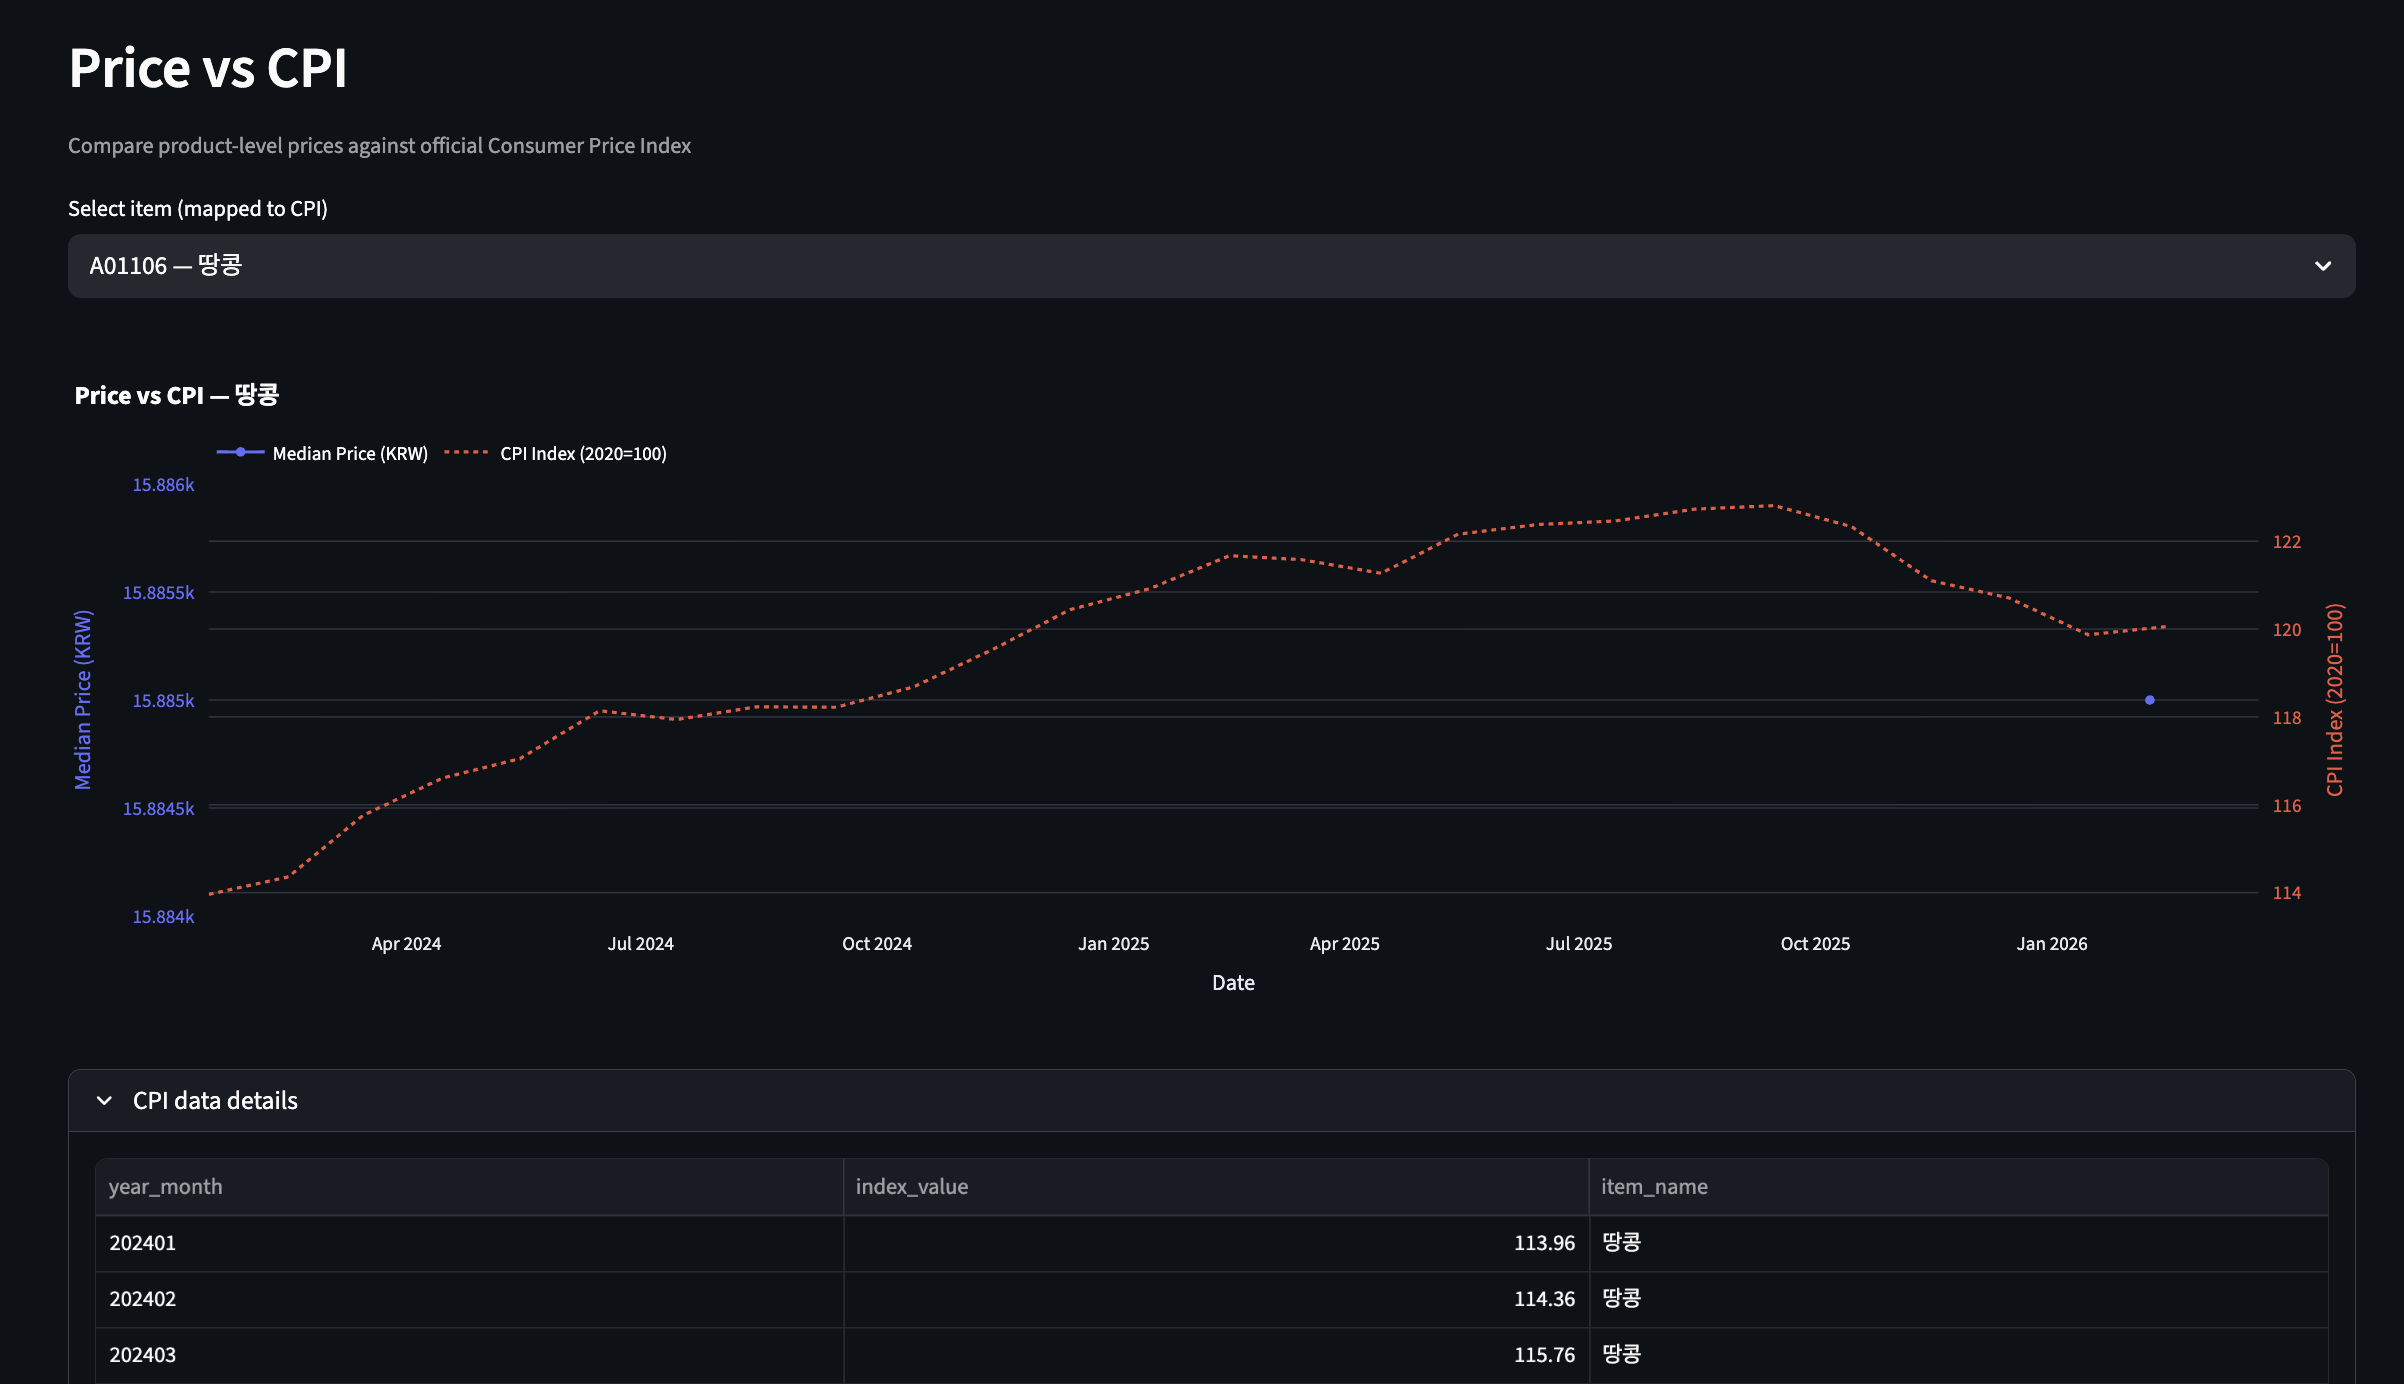
2. Price vs. CPI — the "so what?" page
Dual-axis overlay of actual median product price (left, KRW) against the official CPI index for that category (right, base year 2020=100). The callout below calculates "Product prices changed +X% while CPI changed +Y%." When product prices outrun the CPI, that's a category where official inflation may be understating real consumer cost increases — or where e-commerce pricing simply differs from the broader market the CPI measures.
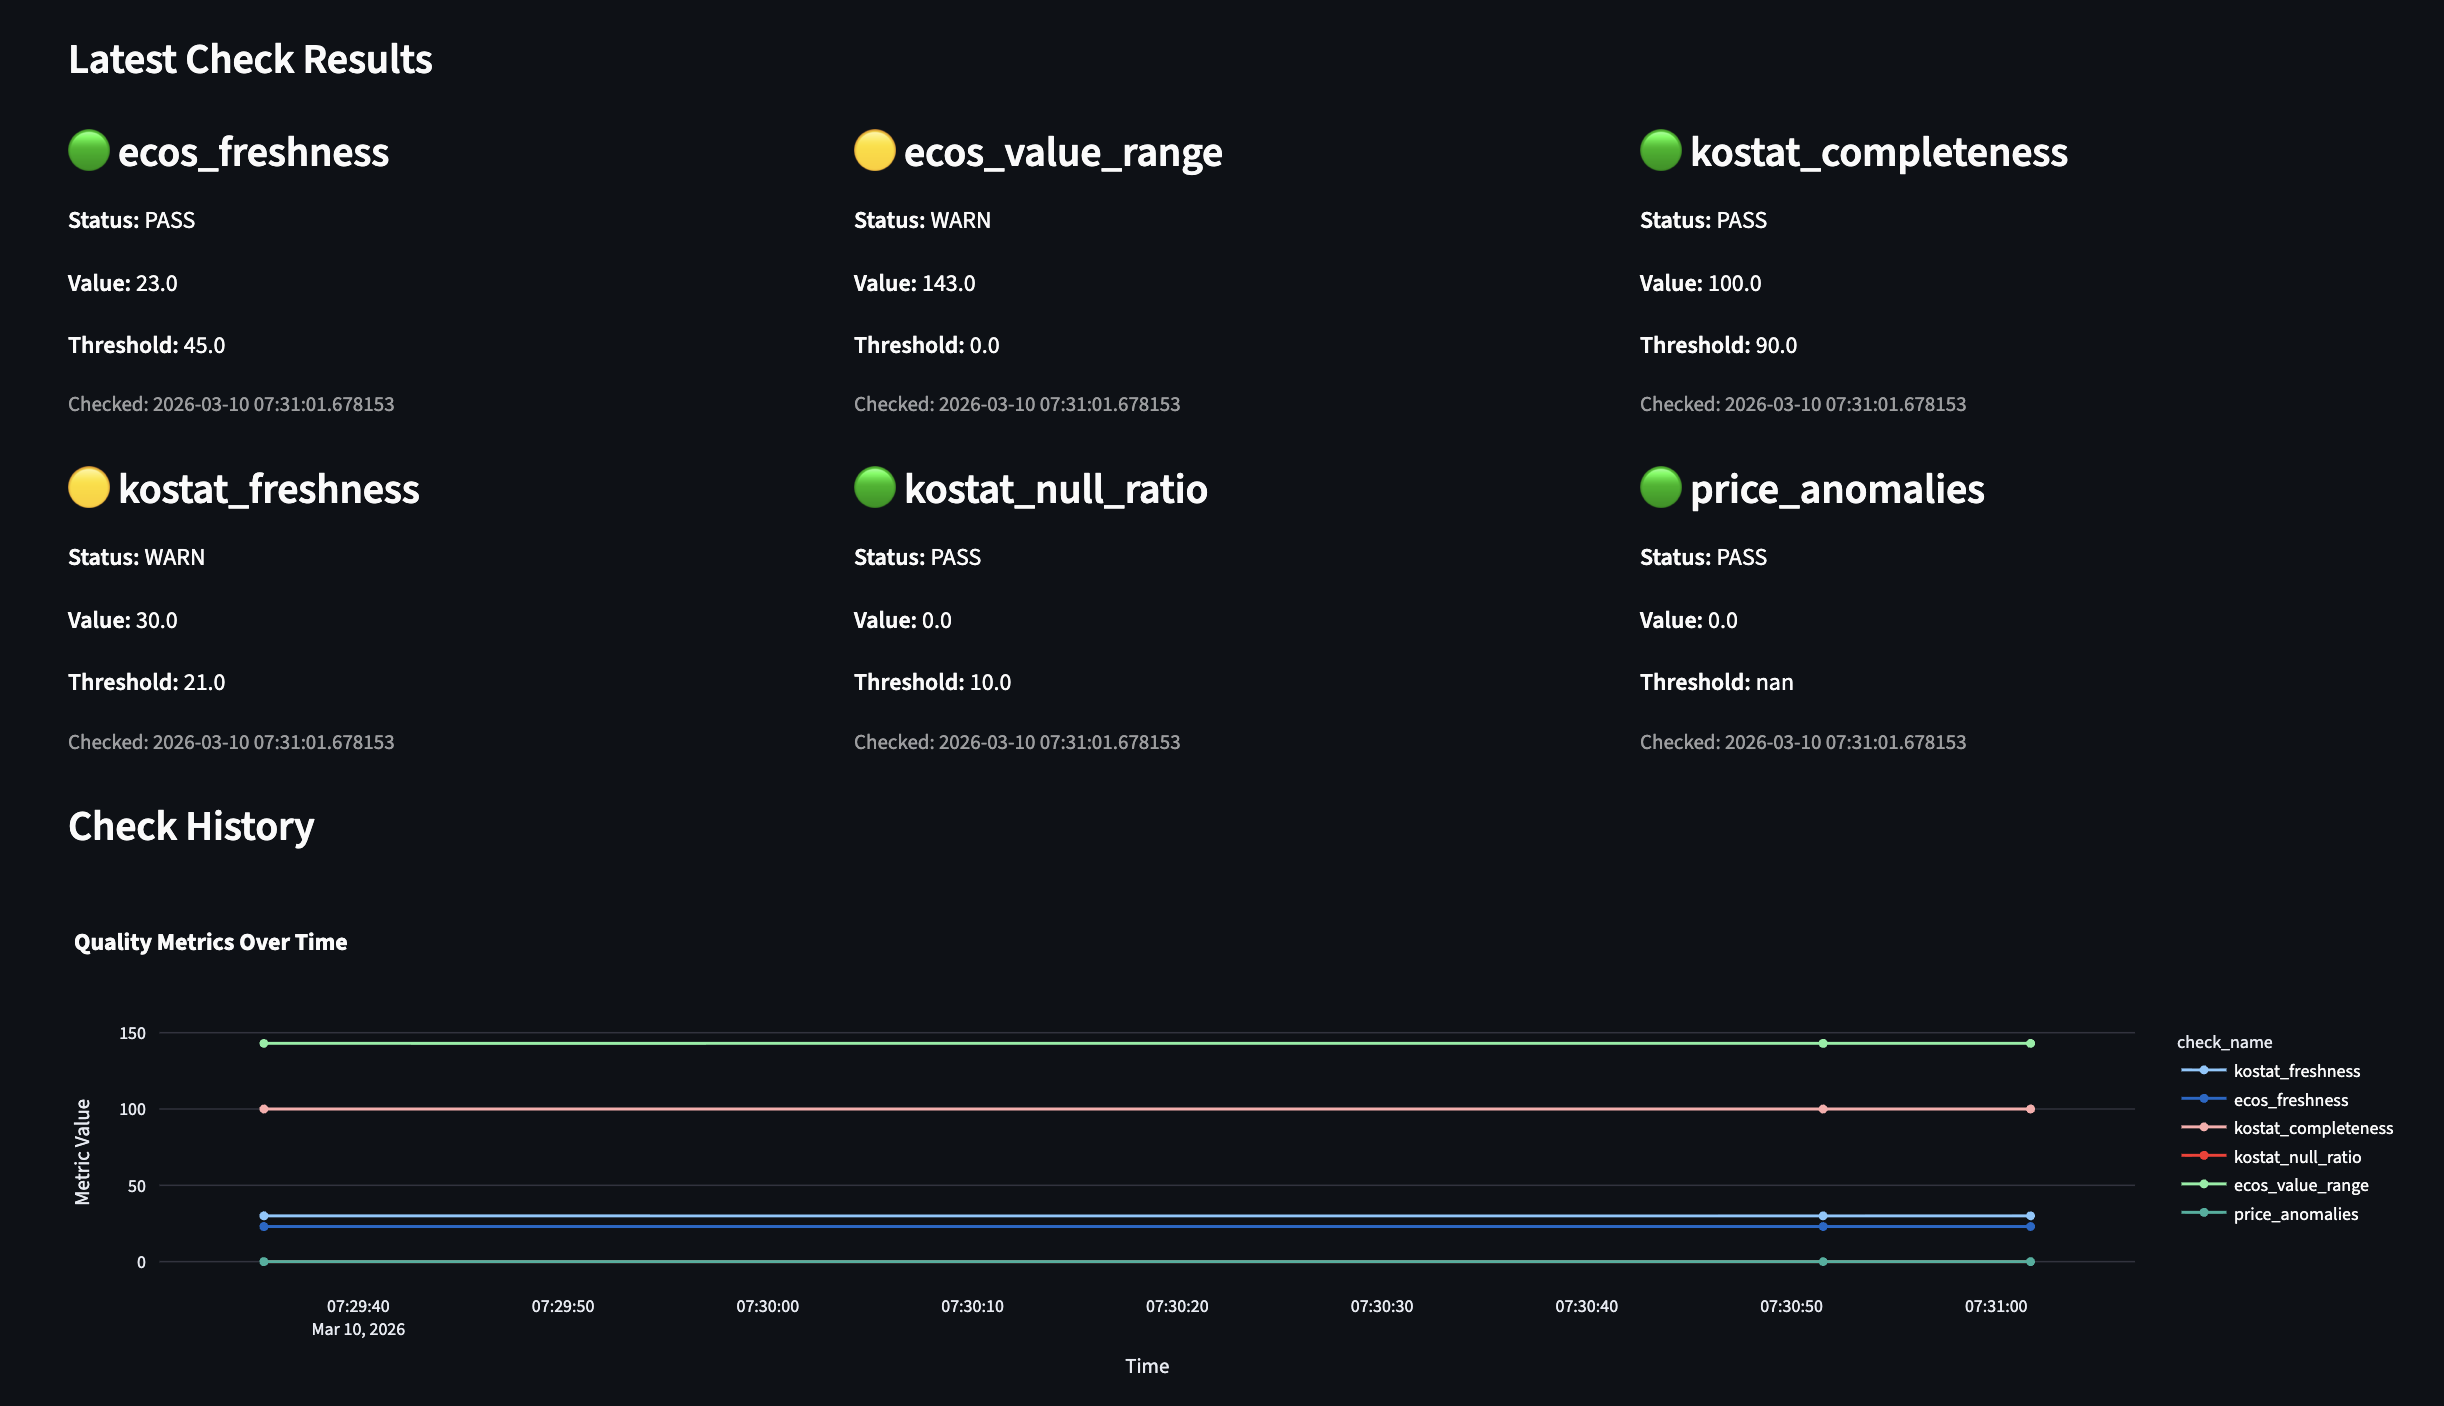
3. Data Quality Health
6 quality checks rendered as color-coded cards (green pass / yellow warn / red fail), historical line chart for gradual degradation, and a flagged-anomalies table from the IQR-based detector.
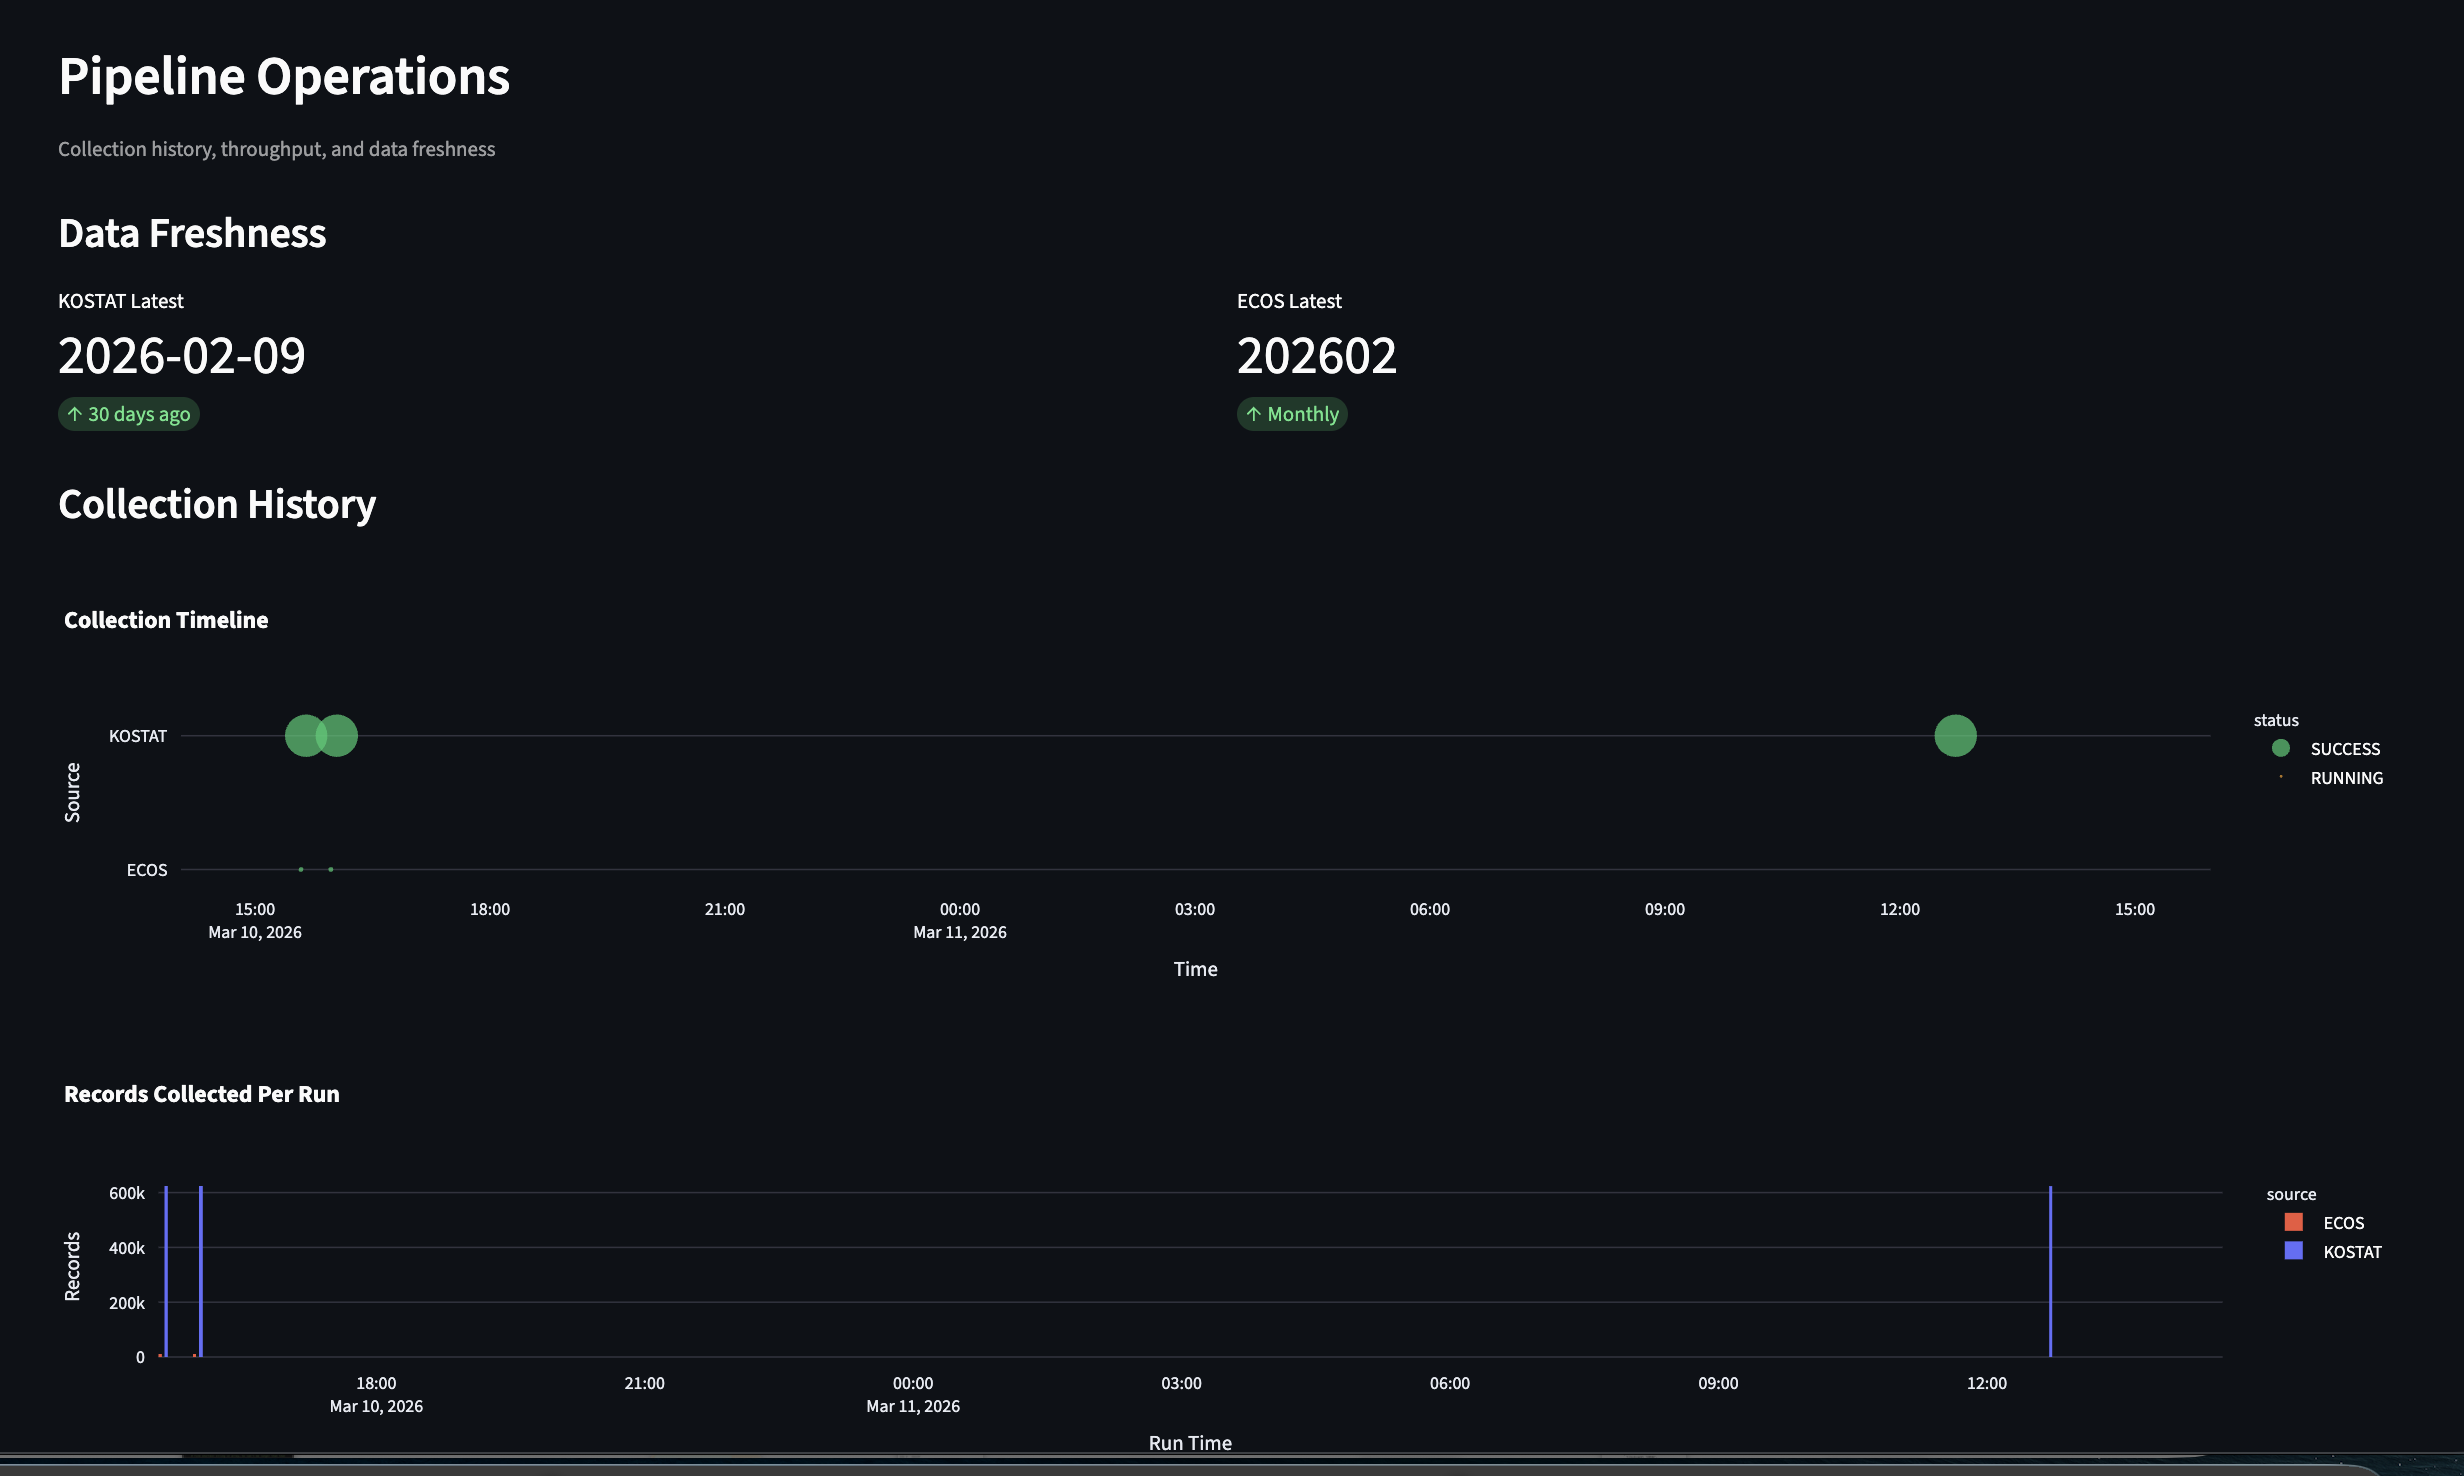
4. Pipeline Ops
Operational monitoring: data freshness indicators, a per-run scatter plot of every collection (color = success/failure, size = record count), records-per-run bar chart, and full log table.
Limitations
What this pipeline doesn't do, explicitly.
- Not truly real-time. KOSTAT data has ~2-week lag despite the project name. Weekly collection is the best possible cadence.
- Single-machine deployment. No HA, no cloud infra. Designed as a portfolio piece, not a production service. AWS cost estimate (~$35–50/month) is in
docs/cost-analysis.mdbut not committed work. - No PPI / wholesale data yet. ECOS exposes PPI stat codes
404Y014–404Y017that would complete the inflation story (consumer ↔ wholesale ↔ official). Documented in the roadmap but not implemented. - Dashboard has no auth. Streamlit runs locally with no user management — fine for a portfolio, not deployable as-is.
Lessons Learned
Thresholds need data, not theory. Every quality check I tuned by intuition first and observation second produced false positives until I rebuilt against the actual distribution.
What worked. Writing an ADR for each major decision. Overkill on a solo project, technically — but it forced me to engage with the why of each choice rather than the what, and it meant later changes were grounded in prior reasoning rather than reflex.
What didn't. I assumed government API documentation could be trusted. The KOSTAT API in particular diverges from its docs in ways that fail silently: successful responses omit the result code, item codes are 6 characters where docs say 7. A whole class of early bugs came from believing the docs over what the API actually returned. One hour spent inspecting actual API responses before writing the collector would have saved several days of debugging.
What I'd do differently. Start with a small sample of real API responses, not the docs. Specifically, build a "what does this endpoint actually return?" diagnostic step as the very first piece of the pipeline, before any business logic. That diagnostic would also be the natural place to seed the schema-drift-detection baseline.