Veterans & Career Trajectories
A 4-year longitudinal test on 5,728 Korean men — does mandatory military service actually shift career trajectories? The data ran opposite to my prior.
Overview
Folk wisdom said two years of mandatory military service would set me back. The data — properly tested — said the opposite.
Korean men spend roughly two years in mandatory military service in
their early twenties. Whether that shifts careers — accelerates,
delays, or has no measurable effect — is debated constantly on the
basis of anecdote. This project takes four years of the
YP2021 Youth Panel Survey (KEIS, 2021–2024), tracks
career_score, career_certainty, and
career_indecision across waves for 5,728 Korean men
split into three groups (Veterans, Non-service, Pre-enlistment),
and applies non-parametric tests appropriate to the score
distributions. The result, against my own prior: veterans show
persistently higher career-development scores across all
four waves, with within-person paired changes that are
statistically significant at extreme p-values
(p = 2.3 × 10⁻⁴⁵ for the veteran group).
The finding is correlational, not causal — the analysis doesn't address selection effects, and the Limitations section below names them explicitly. The point of this project was less to "prove military service is good for careers" and more to replace a confident prior with evidence and a defensible test.
Stack
The Question
Everyone has an opinion about military service and careers. Almost nobody runs the test.
Three conventional claims circulate in roughly equal proportion: (a) military service delays career development (1.5–2 years lost while peers gain work experience); (b) it accelerates career development by forcing structure, discipline, and reflection; (c) it has no measurable effect either way. Korean families make real decisions on this — when to apply to grad school, when to take an internship, when to enter the job market. If those decisions are calibrated to an assumed penalty that isn't actually in the data, that's worth knowing.
The YP2021 panel — KEIS-administered, tracks the same individuals across waves — has exactly the structure needed to test the claim, and is largely confined to academic publications rather than answering the question regular people are actually asking.
Methodology
Three analyses, three statistical questions, three matching non-parametric tests. Method chosen for the data, not the data re-shaped to fit a preferred method.
The score distributions visibly violated normality (skew + ceiling effects on a 1–5 scale), so every test in this analysis is non-parametric. Three analyses build the case: group trajectories over time, categorical state transitions (low → high career certainty), and within-person paired changes.
| Question | Method | Why this method |
|---|---|---|
| Do groups differ at baseline? | Kruskal-Wallis on Wave 1 scores |
Three-group comparison; non-parametric so it doesn't assume
normal score distributions. χ² = 28.95,
p < 0.0001 on career_score.
|
| Do trajectories diverge across 4 waves? | Group means + 95% CIs over time | Descriptive, not inferential. Shows whether group gaps persist, narrow, or widen across waves. |
| Who moves from low to high career certainty? | State transition matrices (W1 → W4) | Categorical mobility ignores within-category variation but makes "what fraction of low-certainty people became high-certainty" directly readable. |
| Are within-person changes significant? | Wilcoxon signed-rank (paired) | Tests median shift in paired W1→W4 changes inside the same individual. Robust to non-normal change distributions; doesn't require homogeneity between groups. |
Pipeline
Four years of YP2021 .xlsx files → 19,952 observations across 5,728 unique participants → three analyses ready in one notebook.
KEIS distributes the YP2021 panel as one Excel workbook per wave.
Loading them with pandas' default read_excel on a
constrained machine ran out of memory; I wrote a custom XLSX
parser that opens the workbook as a ZIP archive and extracts only
the columns I need (sampid, f201,
f202c, e509, plus the career-score
inputs) by scanning the sheet XML directly. That dropped peak
memory by an order of magnitude and was fast enough to re-run
during exploration.
| Stage | Rows | Notes |
|---|---|---|
| Raw waves (per file) | 12,213 × 4 | 4 .xlsx files, one per wave, all Korean men aged ~15–29 |
| Unique participants (paneled) | 5,728 | Joined on sampid across waves |
| Total person-wave observations | 19,952 | Mean 3.48 waves per participant; balanced panel |
| — Veterans | 4,381 | Service completed within observation window |
| — Non-service | 809 | Had not served by Wave 4 |
| — Pre-enlistment (planned) | 538 | Planned to serve but hadn't yet — the most useful comparison group (less self-selected than the non-service group) |
Findings
Three analyses, three concordant signals — veterans start higher, stay higher, and show the largest within-person improvement. All highly significant; none of them causal.
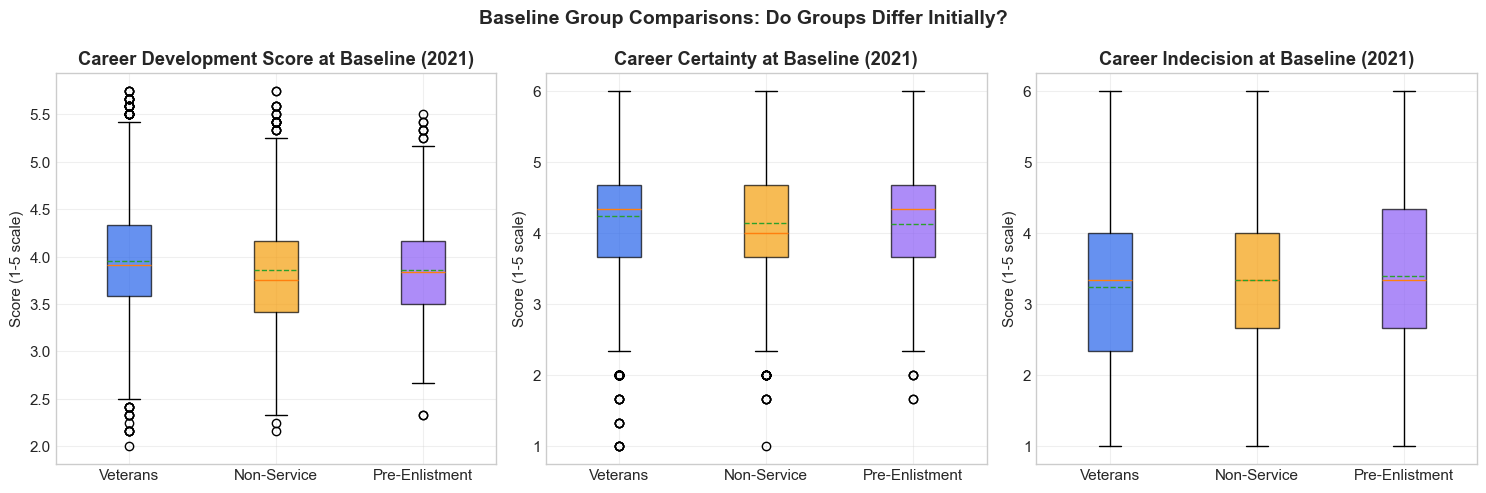
1. Baseline (Wave 1, 2021): veterans already start higher
On a 1–5 career-development scale at Wave 1, veterans average
3.95, non-service 3.86, and pre-enlistment
3.86. Kruskal-Wallis confirms the baseline differences are
real (χ² = 28.95, p < 0.0001) — and this is the
critical caveat for everything that follows: groups already
differed before service. Whatever happens later is happening
on top of a pre-existing gap. Selection-effect concerns enter
here, not in the change scores.
p < 0.005.
2. Trajectories: the gap holds across 4 waves
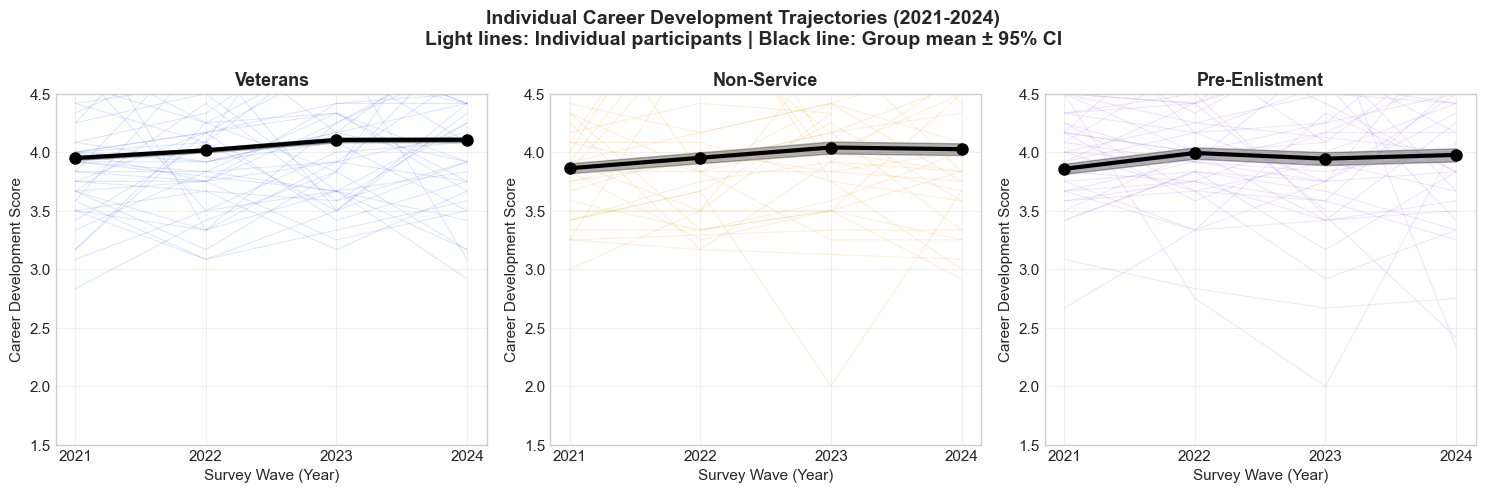
From Wave 1 (2021) to Wave 4 (2024), all three groups improve. The gap between veterans and the others persists — it doesn't widen or close. Mean differences are small in absolute terms (~0.08–0.24 points on a 5-point scale) but consistent across every wave.
| Group | Wave 1 (2021) | Wave 4 (2024) | Δ over 4 years |
|---|---|---|---|
| Veterans | 3.95 | 4.11 | +0.16 |
| Non-service | 3.86 | 4.02 | +0.16 |
| Pre-enlistment | 3.86 | 3.98 | +0.12 |
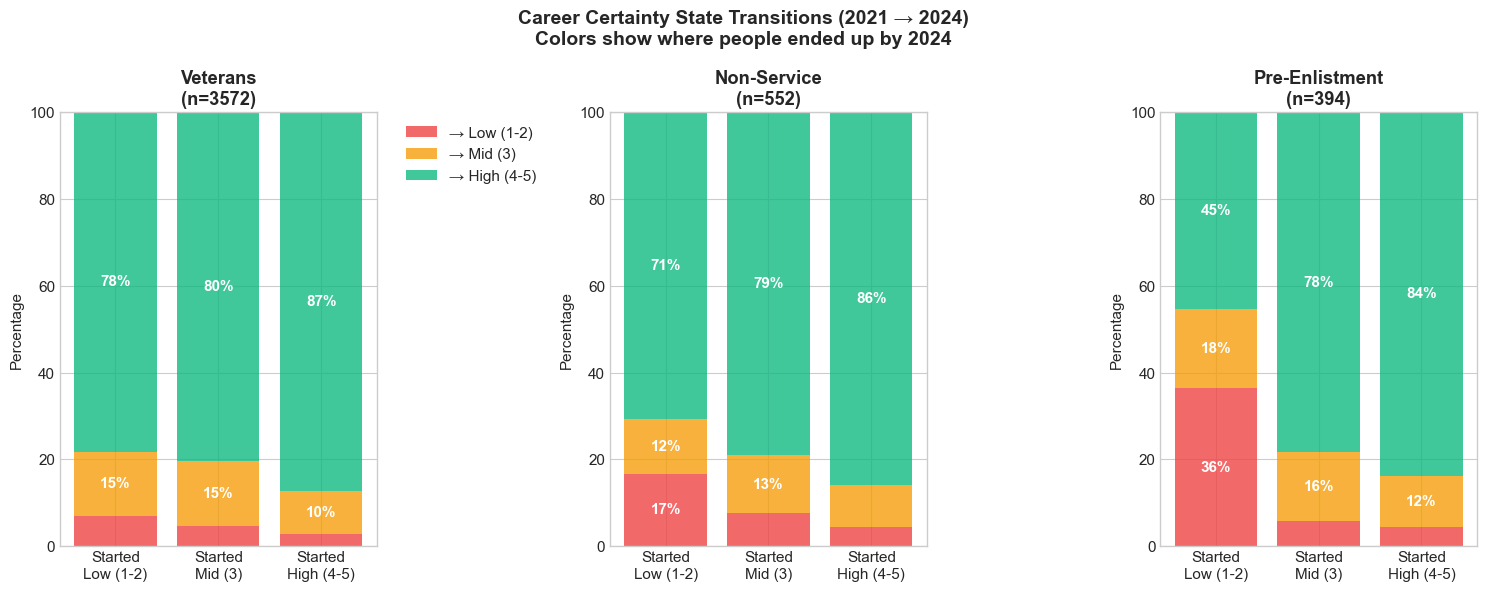
3. State transitions: 78.2% of low-certainty veterans moved to high certainty
Recoding the 1–5 scale into Low (1–2) / Mid (3) / High (4–5) and tracking who moves where between Wave 1 and Wave 4 surfaces the sharpest single number in the analysis. Among participants who started with low career certainty in 2021:
4. Paired Wilcoxon: within-person changes are all highly significant
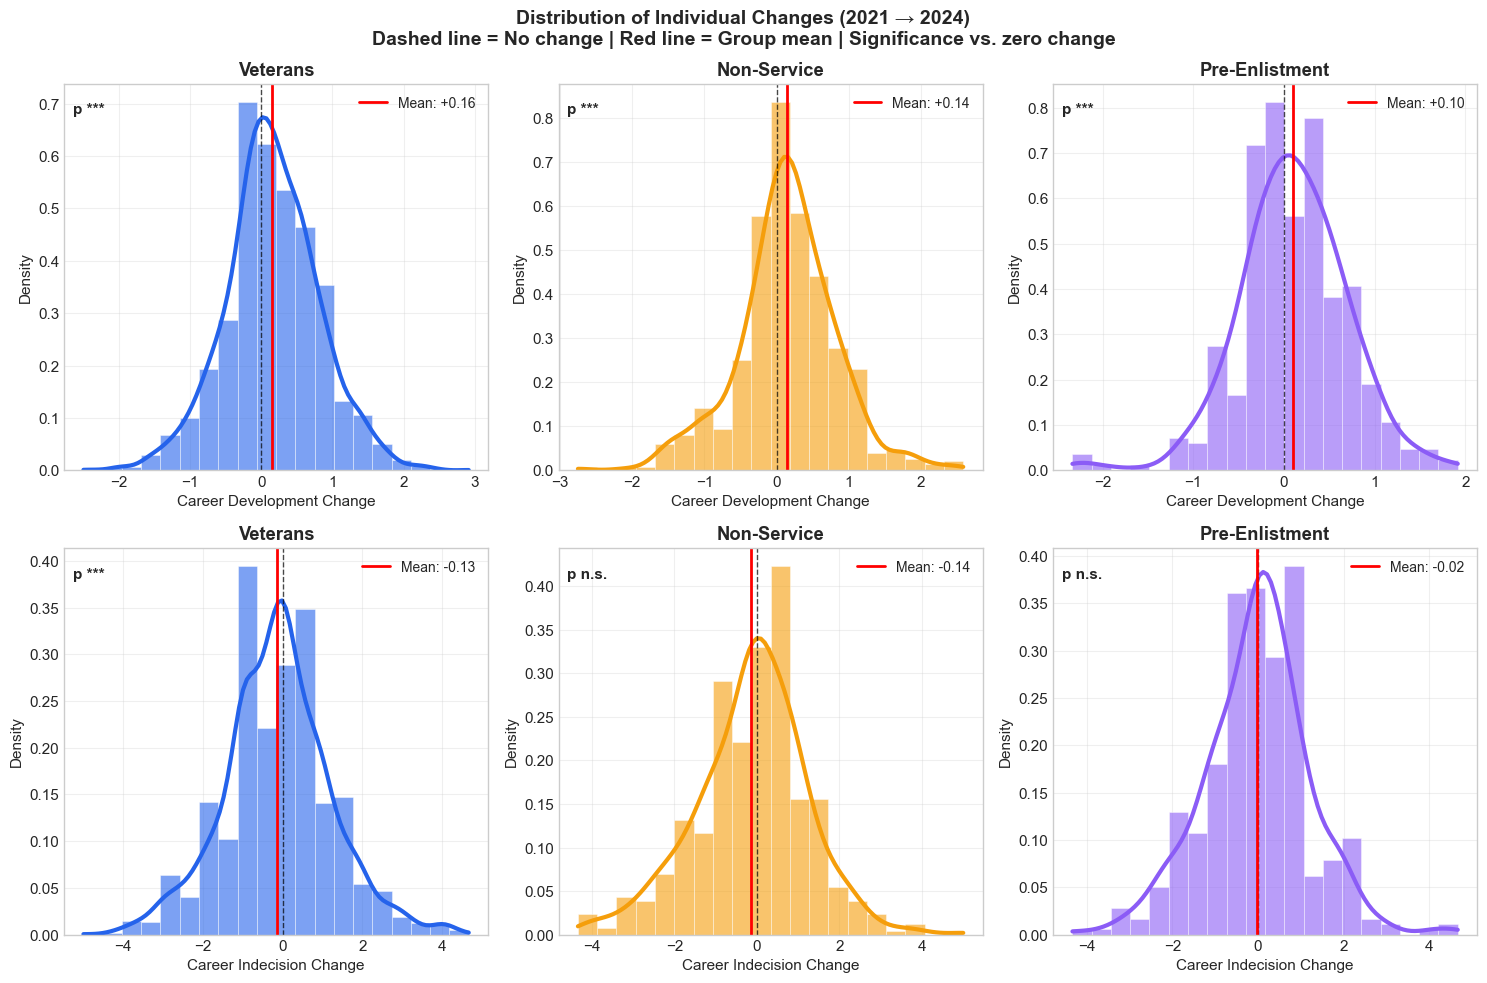
The strongest test in the notebook isn't the between-group comparison — it's the paired within-person test, which asks "did the same individuals improve from W1 to W4?" without relying on group composition. All three groups show statistically significant positive change at extreme p-values; veterans show the largest mean paired increase.
| Group | n | Mean paired Δ | % improved | Wilcoxon p |
|---|---|---|---|---|
| Veterans | 3,572 | +0.157 | 56.7% | 2.31 × 10⁻⁴⁵ |
| Non-service | 552 | +0.142 | 58.7% | 2.63 × 10⁻⁸ |
| Pre-enlistment | 394 | +0.101 | 54.1% | 2.50 × 10⁻⁴ |
Limitations
What this analysis cannot claim. Written explicitly so the finding can be defended on its own terms.
- It's correlational, not causal. Veterans aren't randomly assigned. The ~9% of Korean men who don't serve are exempted for medical reasons, family hardship, or other circumstances that themselves correlate with career outcomes. The correlational direction is interesting; the causal direction isn't settled by this design.
-
Baseline difference exists before service. Veterans
already average 3.95 vs. 3.86 at Wave 1 (Kruskal-Wallis
p < 0.0001). Whatever happens later is compounded with — not separable from — that pre-existing gap. - Career-development indicators are self-reported on a 1–5 scale. Ceiling effects are visible in the distributions; the practical-significance interpretation of a 0.16-point shift depends on what "4 vs. 4.16" means to a respondent.
- The Wilcoxon test detects median shift, not the cause of it. A significant p-value on within-person change tells us the change isn't zero — it doesn't tell us the change is caused by service, by aging, by COVID-era labor market shifts, or by a hundred other co-occurring factors.
- Generalization is bounded by context. Korean mandatory military service has specific duration, structure, and labor market interaction. The finding may not transfer to voluntary service contexts elsewhere.
Lessons Learned
The biggest lesson was epistemic, not technical: I'd argued confidently for years from a position the data didn't support.
What worked. Picking non-parametric tests up front saved me from the parametric-tests-on-non-normal-data trap that a lot of social-science analysis falls into. Looking at distributions before picking a test is unglamorous and matters a lot. Pairing the Wilcoxon within-person test alongside the between-group comparison was also important — the between-group result is contaminated by selection, but the paired test holds even if selection is severe.
What didn't. The analysis is honest about what it found, but doesn't fully address why. Selection effects are real — the non-service group is small (n=809) and non-randomly composed, so any group-comparison conclusion is structurally limited. The custom XLSX parser worked, but it's tightly coupled to the YP2021 sheet layout; re-running on a new wave would need targeted updates.
What I'd do differently. A method actually designed for
causal inference — propensity-score matching on pre-service
covariates, or a difference-in-differences if I can identify a
clean within-person pre/post-service split for the same
individuals — would move the analysis from "the prior was
backwards" to "here's an estimated causal effect." I'd also
decompose the headline difference into specific drivers (does
the gap come from career_certainty, from
career_indecision, or both?) and run robustness
checks at multiple wave windows.