CDC Event Sourcing Pipeline
WAL → Debezium → Kafka → Python consumer → event log + materialized snapshots. End-to-end CDC with the production gotchas already discovered, documented, and worked around.
Overview
A polling pipeline that SELECTs every 10 minutes silently loses information every cycle. CDC fixes it by reading the database's own log — but the right tool is rarely the easiest one to set up correctly.
Polling has three structural blind spots: intermediate states vanish (CREATED → PAID → SHIPPED in 8 minutes shows up only as SHIPPED), deletes are invisible (you can't see a row that's no longer there), and source-DB load is paid every cycle even when nothing changed. CDC reads PostgreSQL's Write-Ahead Log directly, capturing every row-level change at the moment it happens. This pipeline implements the full pattern end-to-end: PostgreSQL with logical replication, Debezium (inside Kafka Connect) reading the WAL, Apache Kafka as the durable event stream, and a Python consumer that writes both an append-only event log and materialized snapshots of current state. Runs locally via Docker Compose with 5 services, has a 5-page Streamlit dashboard, 8 ADRs, 21 unit tests, and an AWS deployment cost analysis (~$83/month).
Stack
The Problem
Polling-based pipelines silently lose information every cycle. CDC is the right tool — but setting it up correctly is mostly about discovering the gotchas the docs don't surface.
The intermediate-state problem is the clearest motivator: if an order transitions CREATED → PAID → SHIPPED within a polling interval, every downstream analysis sees only SHIPPED. The full lifecycle — how long payment took, which orders stalled at PAID, what percentage were cancelled before shipping — is invisible. That's not just analytical loss; it's the difference between knowing your funnel and guessing at it. CDC fixes the problem at the source, but setting it up correctly is non-trivial: Debezium runs inside Kafka Connect (not standalone), decimal columns come through as base64 by default, the source DB's WAL can bloat if the consumer stops, and out-of-order events show up even on a single Kafka partition because Debezium batches transactions.
docker compose up?
Architecture
Eight ADRs explain why each major design choice exists. The point of doing them on a solo project is to force the tradeoff to be articulated at the moment of decision, not retroactively.
| Decision | Why |
|---|---|
| WAL-based CDC over polling | Captures every state transition; zero load on source DB; deletes visible. |
| Kafka over RabbitMQ | Durable log with replay capability — required for event sourcing semantics, not just messaging. |
| JSONB event log | Schema-agnostic. New columns in source DB appear as new JSON fields without migration. |
| UUID5-based dedup | Deterministic IDs from (table, LSN, txId, primary key). Same event always gets the same ID — at-least-once delivery becomes effectively-once via primary-key dedup. |
| Materialized snapshots derived from events | Current state derived from the event log, not copied from the source. Means snapshots can be rebuilt from events at any time — that's what makes this event sourcing, not just CDC. |
| Dead-letter queue | Failed events get stored, not dropped. Pipeline keeps running and the operator can investigate later. |
Full rationale in 02-DECISIONS.md (8 ADRs total — the table covers the most consequential six).
Pipeline
The full path from a row update in PostgreSQL to a materialized snapshot in the analytics DB.
PostgreSQL is configured with logical replication and REPLICA IDENTITY FULL so every row change emits the full before/after state. The Python consumer (confluent-kafka) does three things per event: writes to the append-only event_log with UUID5-based dedup, updates the materialized snapshots, and records per-minute processing metrics. Failed events land in dead_letter_events rather than crashing the consumer. The whole stack comes up clean from docker compose up + one connector-registration script.
Repo structure
Dashboard
A 5-page Streamlit dashboard surfaces every piece of the system — pipeline health, raw events, processing lag, reconstructed snapshots, and inventory.
1. Pipeline Overview
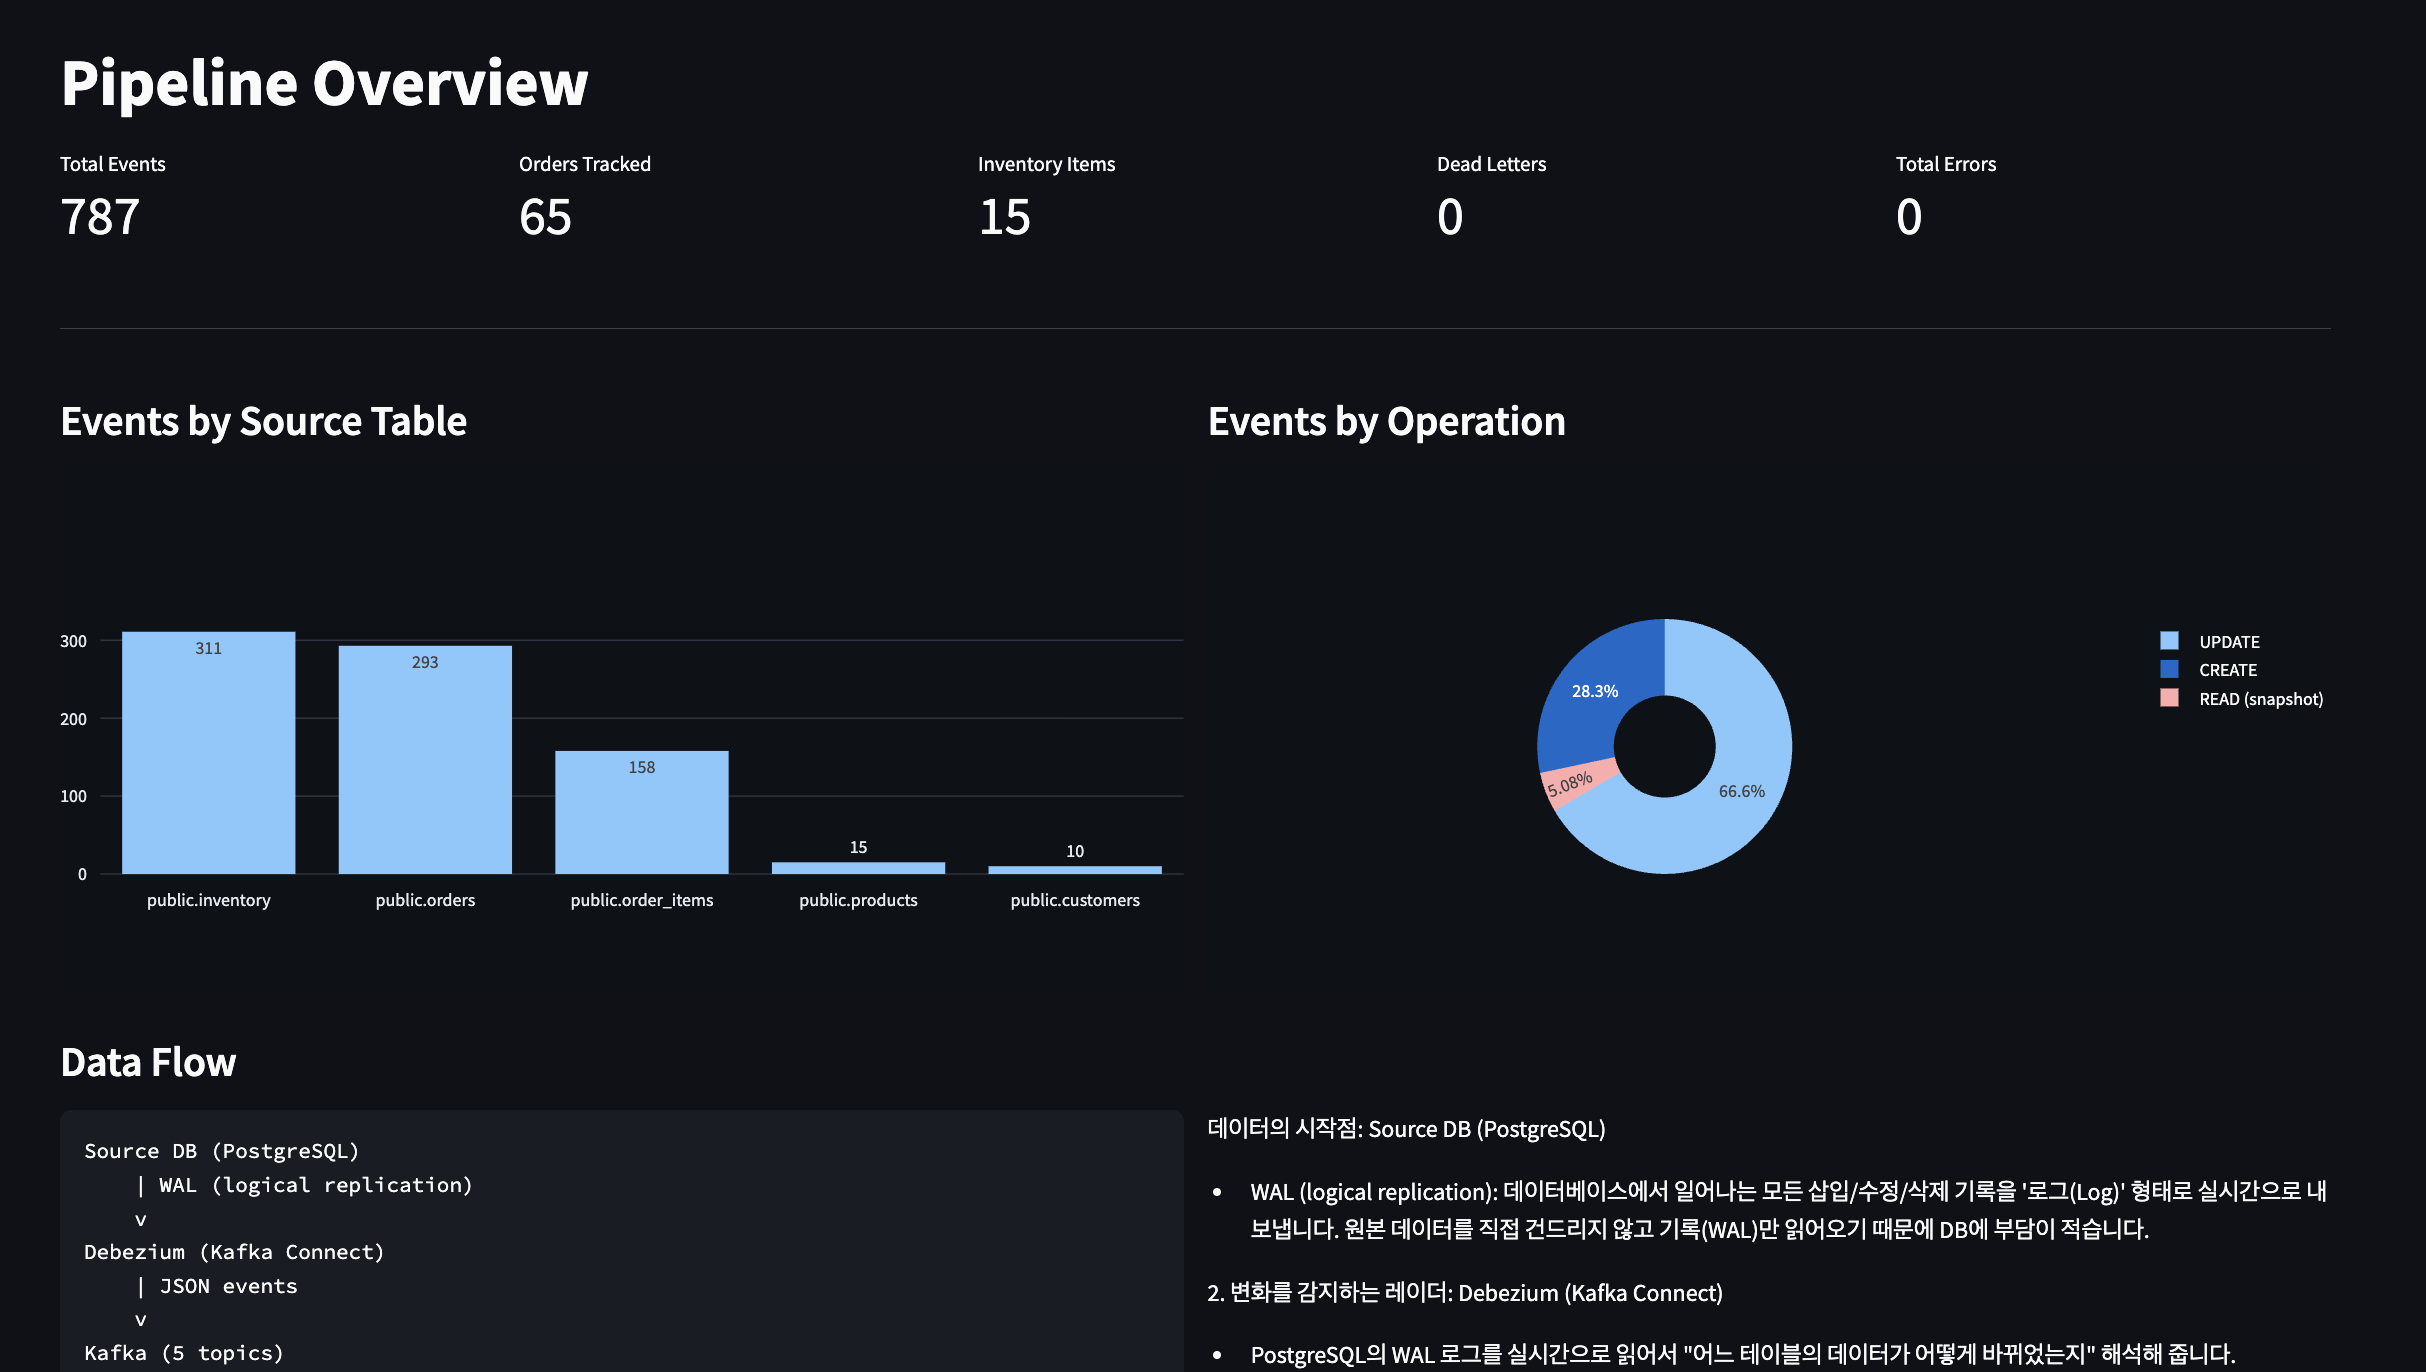
Top-level health check. Five summary metrics, an events-by-source-table bar chart (inventory and orders dominate because each order lifecycle touches both), and an operation-mix pie (66% UPDATE, 28% CREATE, 5% READ — consistent with orders going through 4+ state transitions each).
2. Event Stream
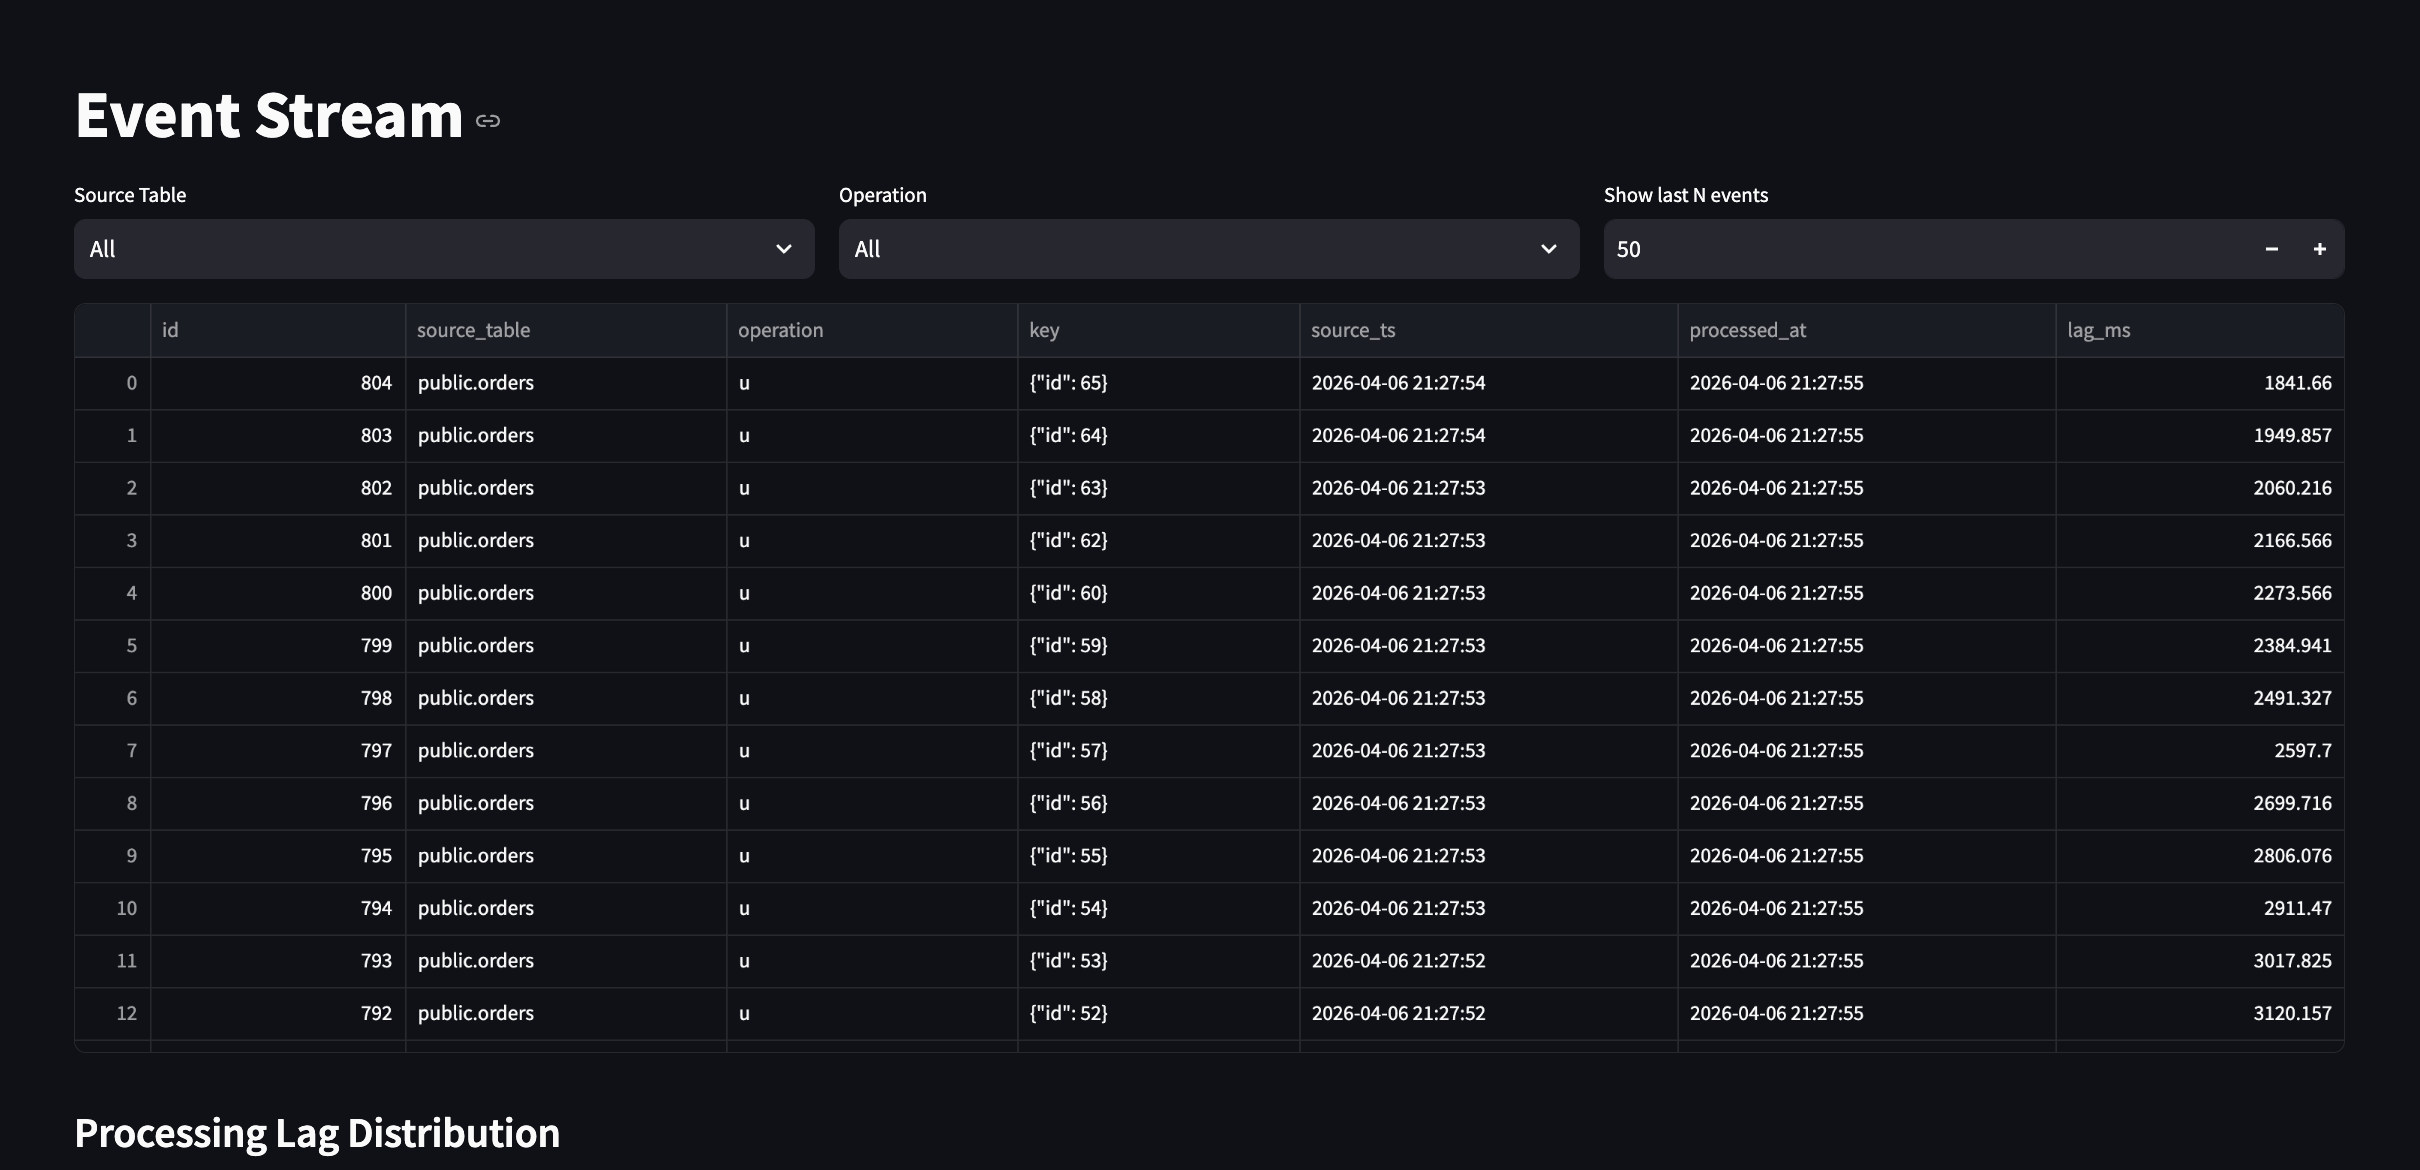
Filterable event log with per-event lag measurement.
3. Processing Lag & Timeline
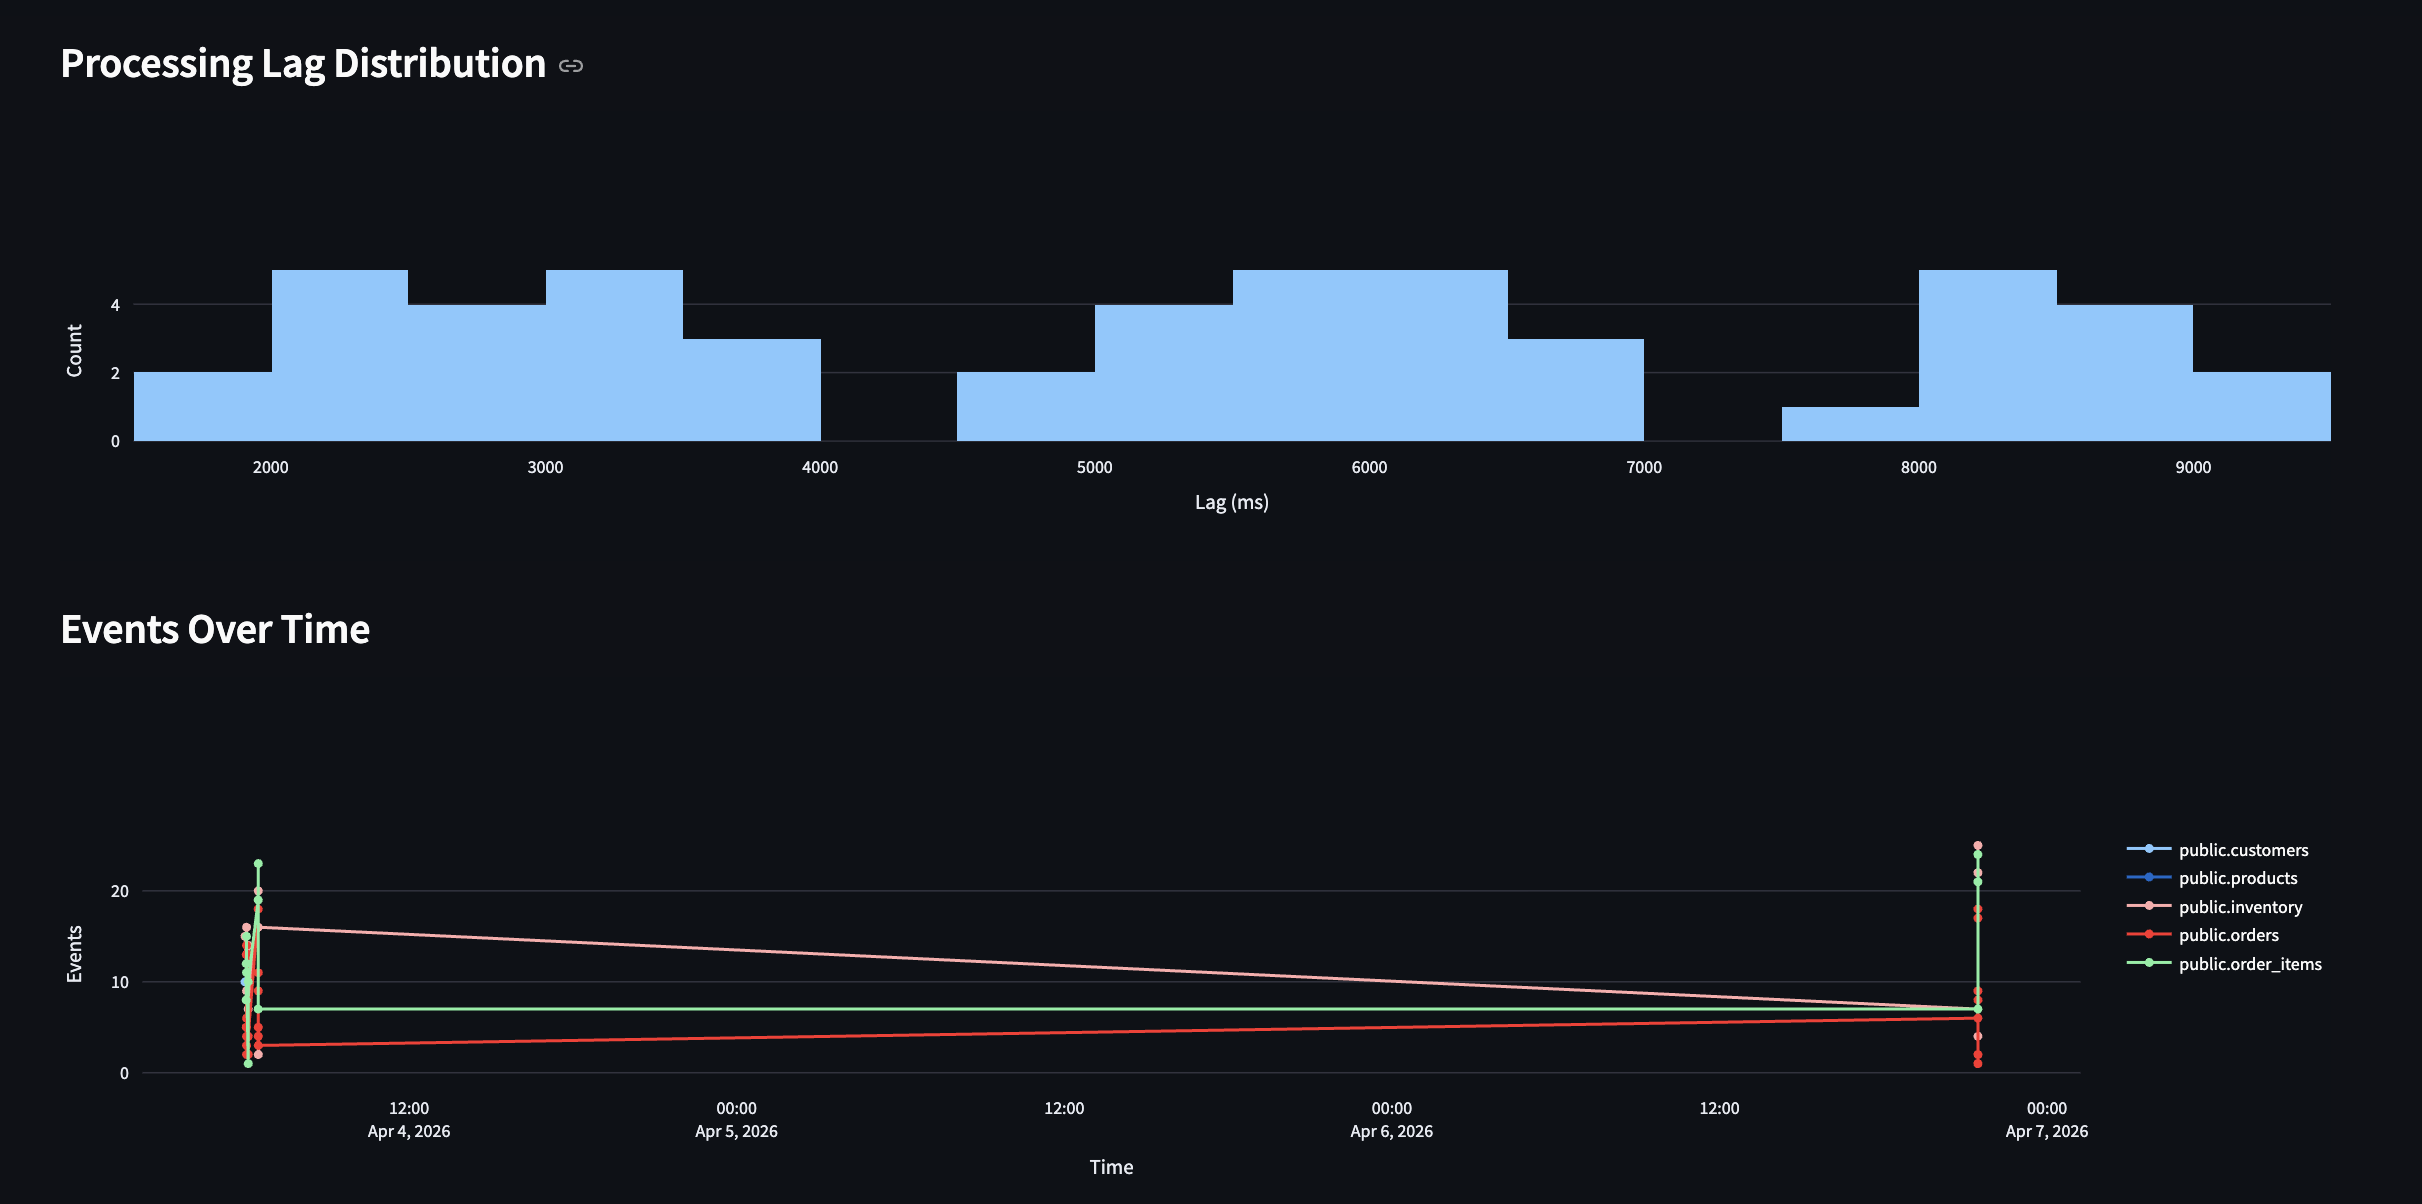
Histogram of lag distribution — most events land in the 1–3s range with a long tail to ~9s during bursts. The two clusters in the timeline correspond to two simulator burst runs.
4. Order Snapshots — the "why CDC matters" page
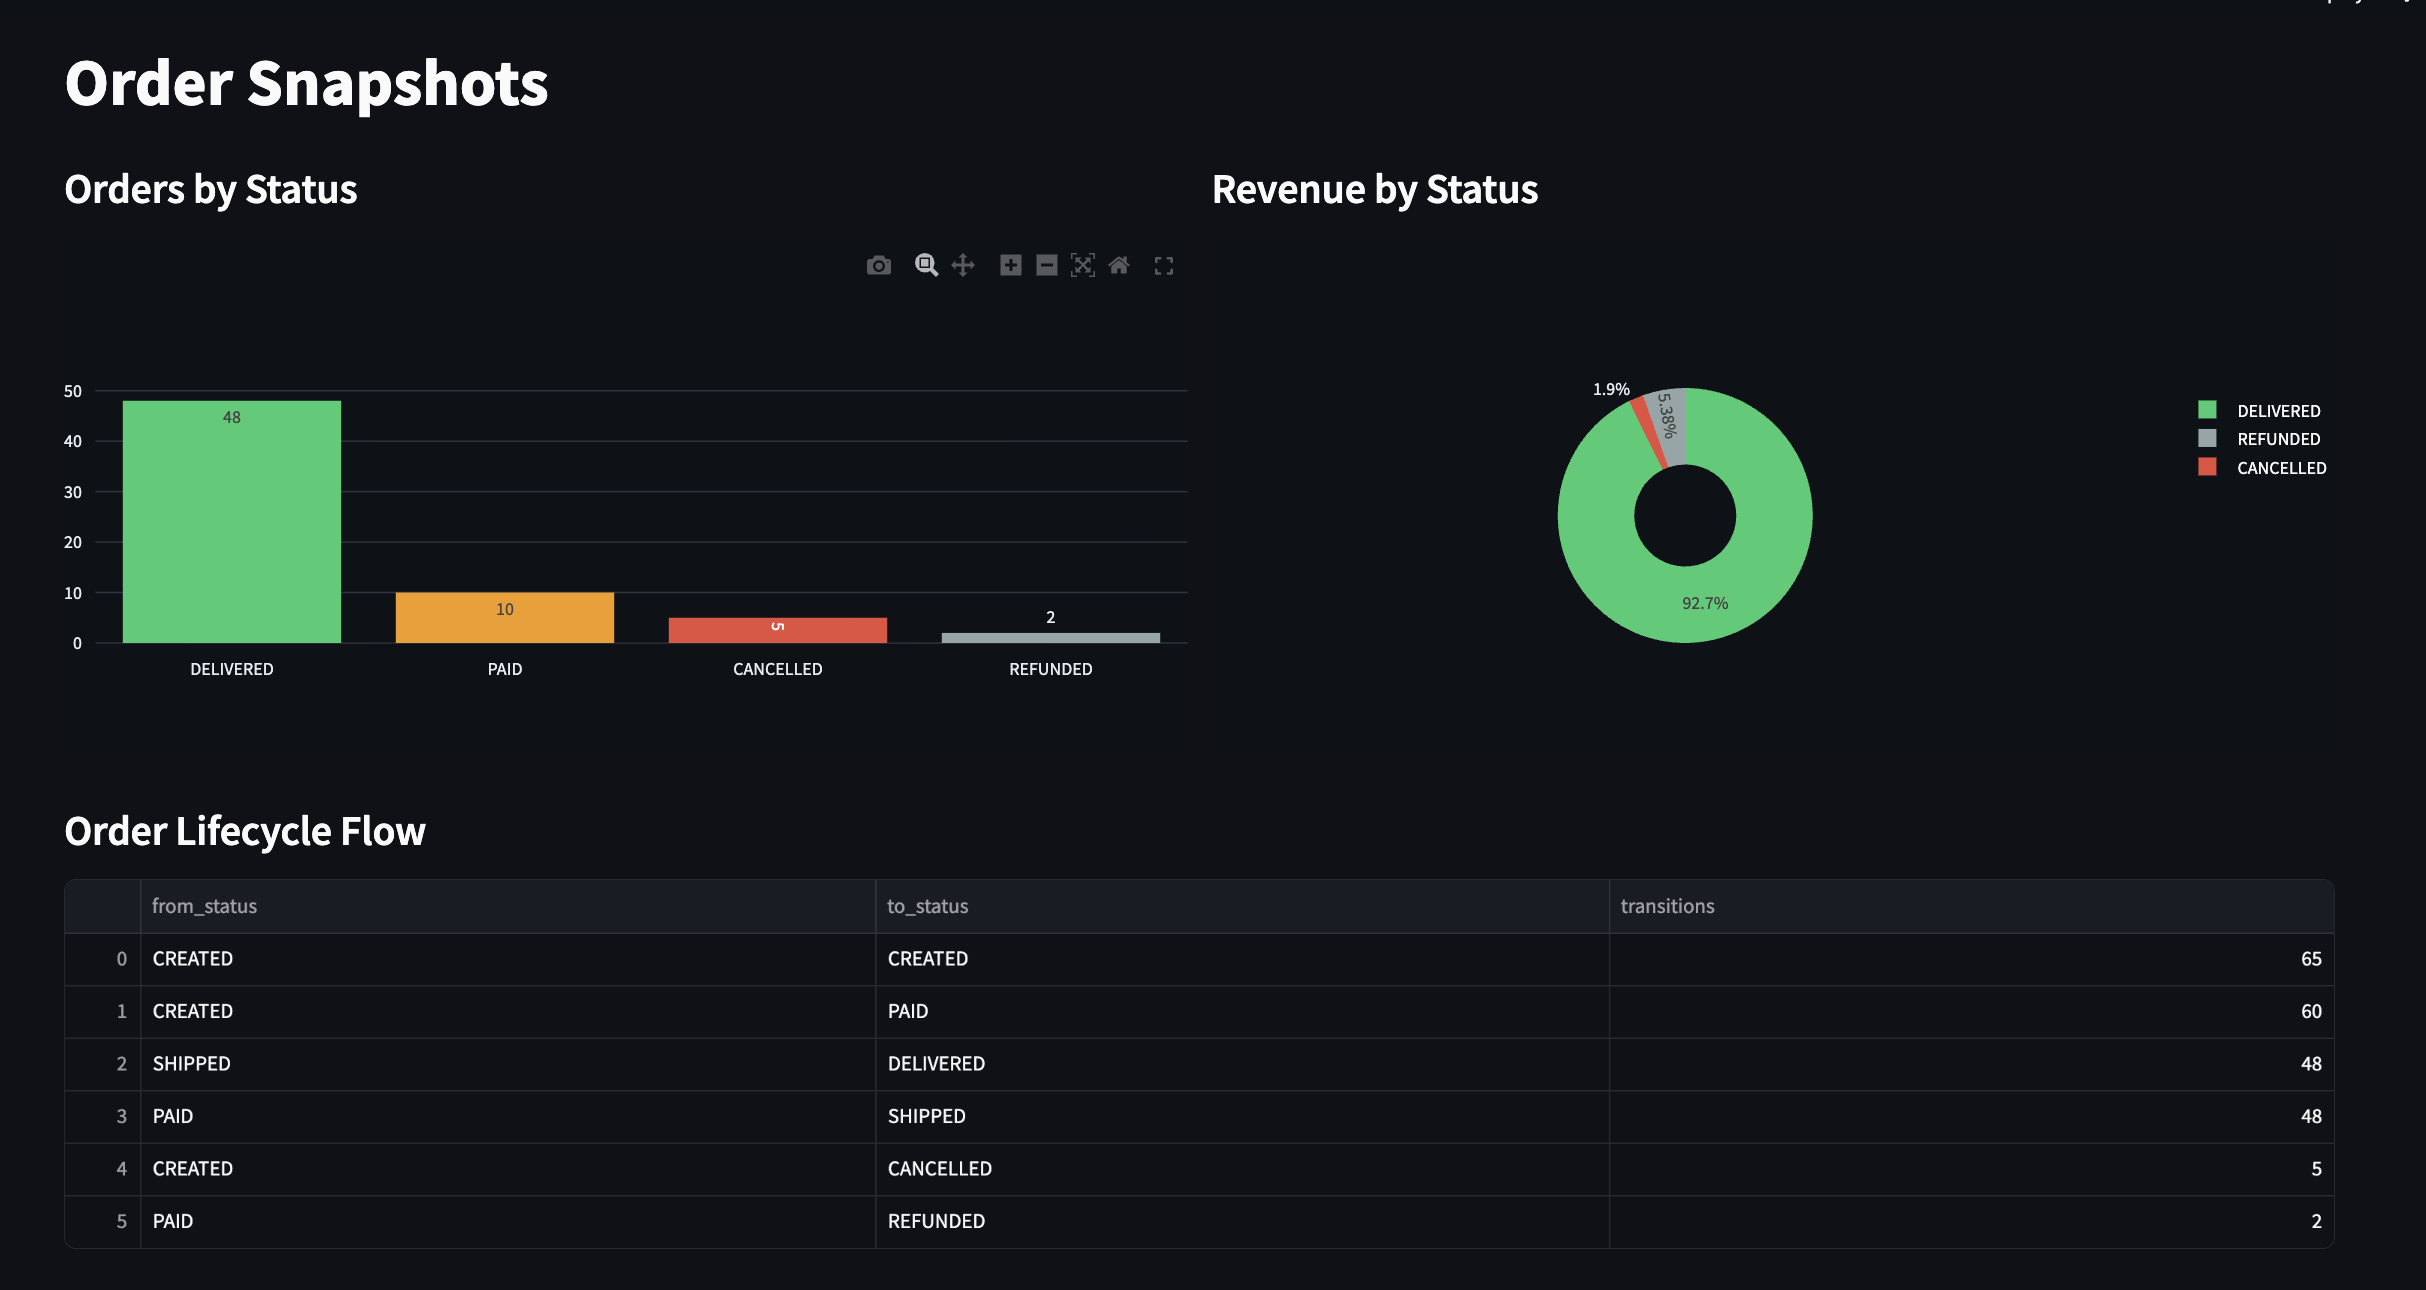
Current order state, derived from CDC events rather than copied from the source. The lifecycle-transition table at the bottom is what polling can never produce: 65 CREATED, 60 CREATED→PAID, 48 SHIPPED→DELIVERED, 5 CREATED→CANCELLED. Every transition captured because the WAL surfaced it.
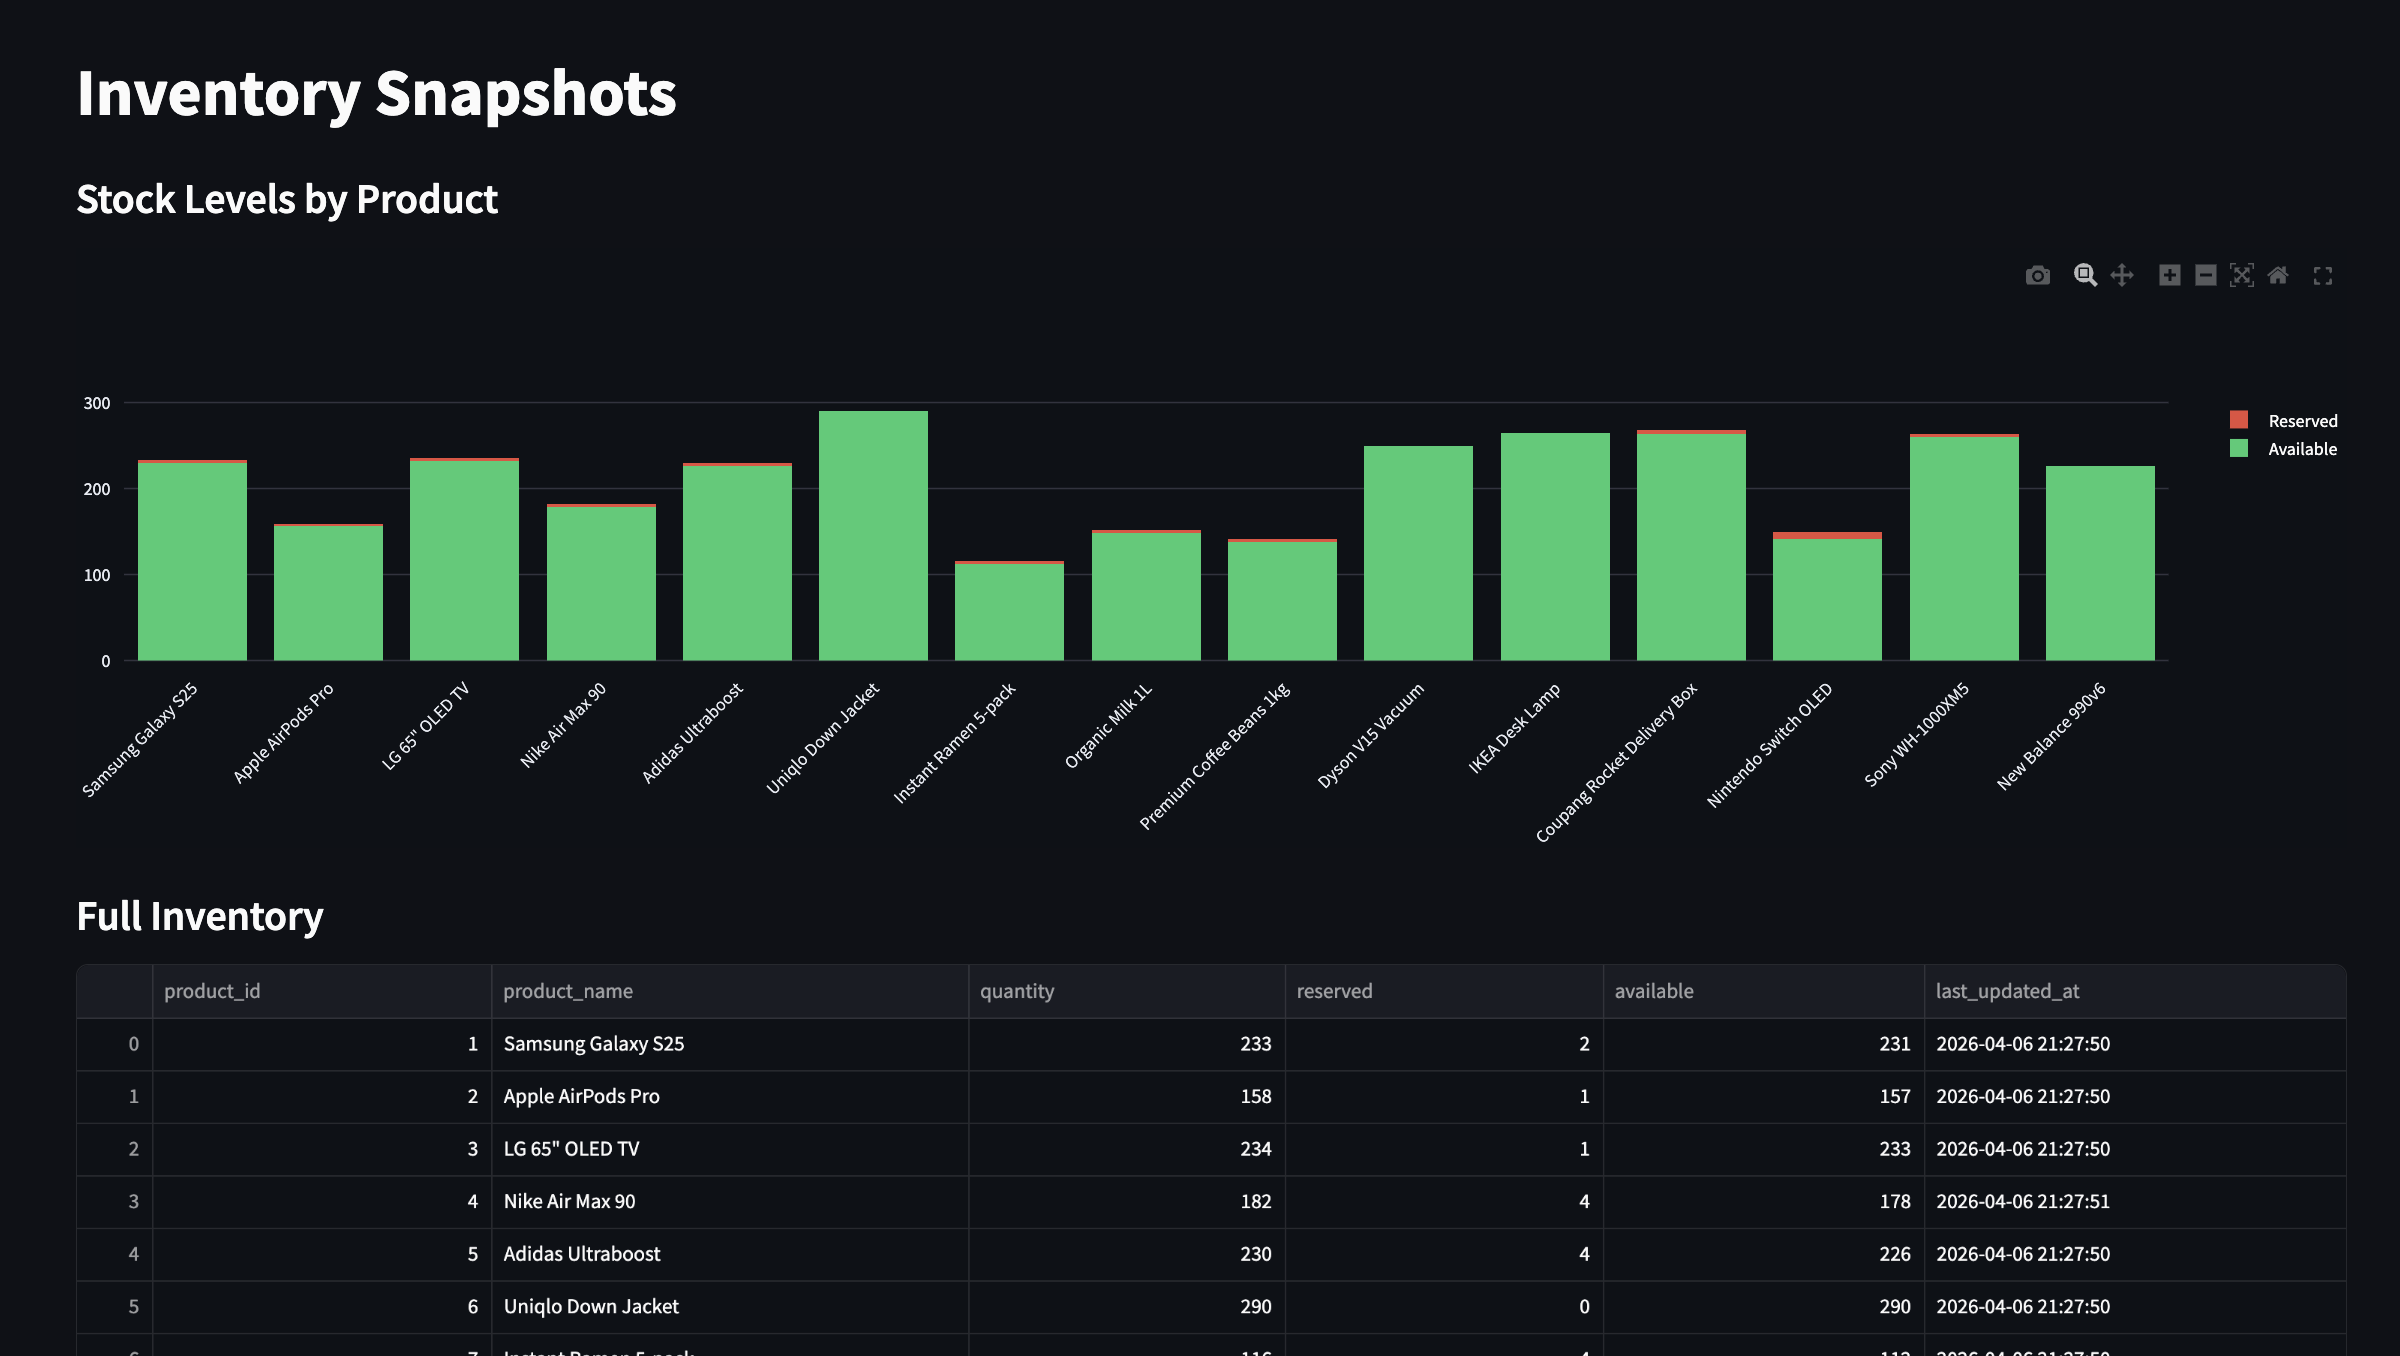
5. Inventory Snapshots
Real-time stock levels for 15 products, computed from CDC events. available is a PostgreSQL GENERATED column (quantity − reserved); the stacked bar shows available (green) vs reserved (red) per product.
Limitations
Where the pipeline stops short of production.
- Single consumer. No partitioned consumption or consumer groups — works for demo scale (~50 events/min), not production throughput.
- At-least-once with dedup, not exactly-once. A crash between DB commit and Kafka offset commit could reprocess events — handled idempotently by UUID5 dedup, but not zero-cost.
- No schema registry. Uses JSONB flexibility instead of Avro/Protobuf + Confluent Schema Registry. Production CDC pipelines should validate schemas at ingest.
- Zookeeper dependency. Uses the bundled image; Kafka 3.x+ supports KRaft mode without Zookeeper. Documented in the roadmap.
- Heavy local resource footprint. Kafka + Zookeeper + Debezium together use ~2–3 GB RAM — not practical on a small laptop without closing other apps.
Lessons Learned
CDC's value proposition is easy to state and surprisingly hard to set up correctly. The gap between "I understand the pattern" and "I have a working pipeline with production-correct behavior" is mostly populated by gotchas the docs don't surface.
What worked. Writing each ADR at the moment of decision, not retroactively. ADRs written after the fact tend to read like marketing for a choice already made; ADRs written in the moment force you to articulate the tradeoff you're weighing — and to come back later and notice when the tradeoff has changed.
What didn't. I underestimated how many gotchas were configuration details rather than design problems. The Debezium decimal-encoding issue (base64 by default, needs decimal.handling.mode: "string") is a one-line config change — but I lost most of a day to it because the failure mode (silently mangled financial values) doesn't look like a config issue from the symptoms.
What I'd do differently. Write a "first-principles sanity check" step into the pipeline from day one — a script that compares raw connector output against source-DB ground truth, flagging any field where the round-trip doesn't match. The decimal-encoding bug, the out-of-order event issue, and a couple of others would have been caught in minutes rather than hours. That's the streaming equivalent of the data-quality validation pattern from the Price Monitor.