Seoul Restaurant Survival
Survival analysis on 528K Seoul restaurant license records — how long restaurants actually live, and what kills them.
Overview
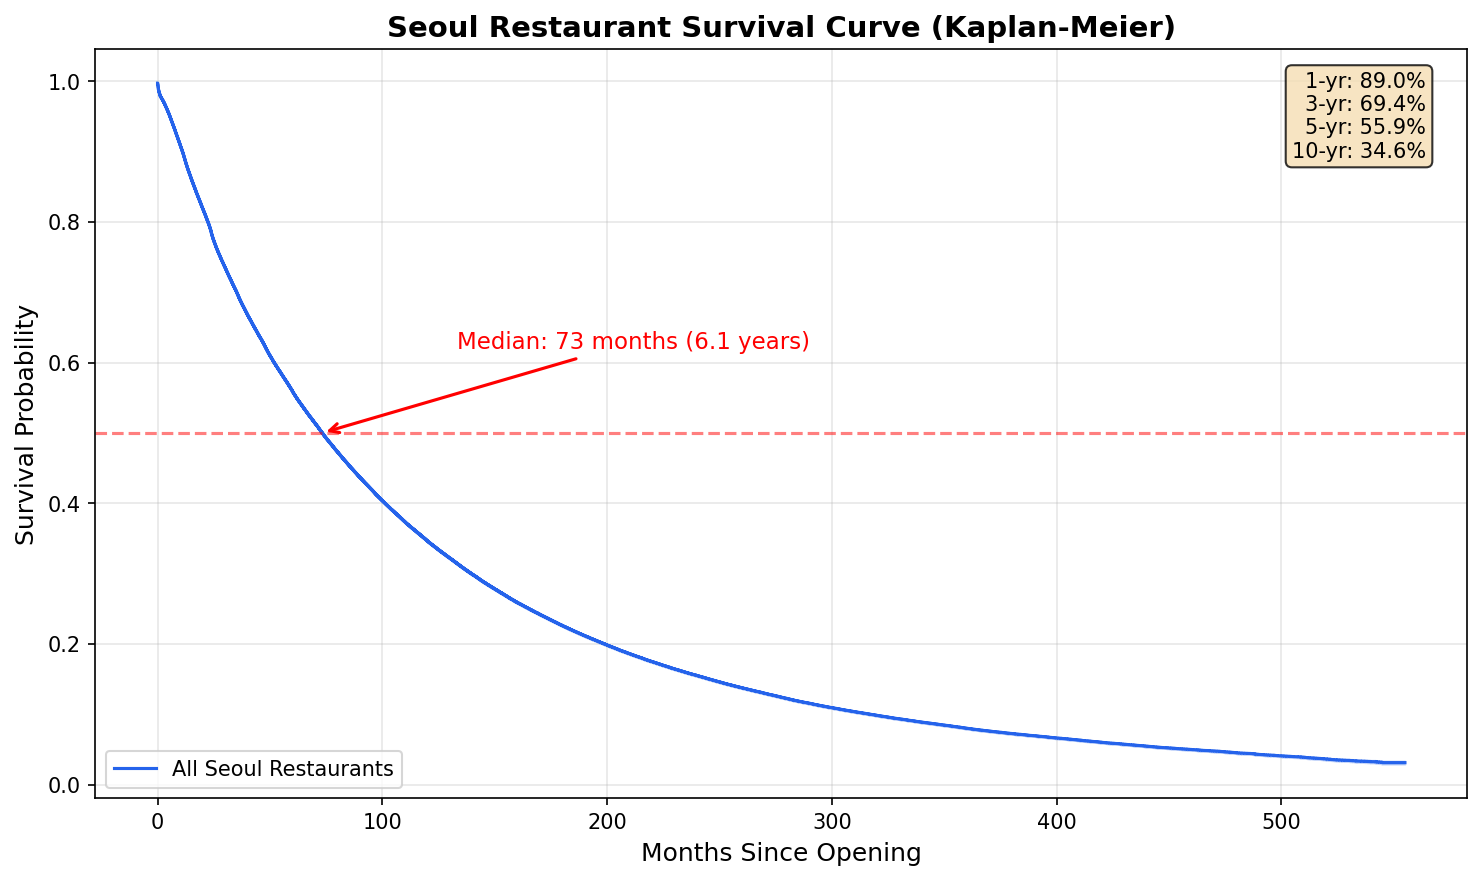
Half of Seoul's restaurants close within 6.1 years — but the naive "77% failure rate" everyone cites is statistically wrong.
Most public reporting on Seoul restaurant survival uses simple closure rates: "X% of restaurants fail." That number ignores restaurants still open (right-censoring) and treats a 1-year-old shop the same as a 10-year-old one. This project applies survival analysis — Kaplan-Meier curves, log-rank tests, and Cox proportional hazards regression — to 528,487 restaurant license records from all 25 Seoul districts, spanning 1980 to 2026. The corrected estimate (median survival of 6.1 years; 5-year survival of 55.9%) is more accurate than the naive framing, and the analysis surfaces three findings the naive rate hides: where you open matters more than what you cook, the COVID-era cohort is closing measurably faster, and restaurants that survive the first three years tend to persist.
Stack
The Problem
"What percentage of restaurants fail?" is the wrong question.
The framing in Korean small-business reporting has two specific statistical problems. First, it ignores right-censoring — 120,151 of the 528,487 restaurants in this dataset are still operating, and we don't yet know how long they'll last. Counting them as "succeeded" inflates the success rate; counting them as "failed" deflates it. Second, treating a 1-year-old restaurant the same as a 10-year-old one ignores exposure time. The right question isn't "how many failed?" — it's "at any given point in time, what's the probability a restaurant is still open?" That's a survival analysis question, not a closure-rate question.
Methodology
Five recorded decisions, each with its own Architecture Decision Record. The right tool first, defended choices second.
Every methodological choice in this project lives in a
03-DECISIONS.md file in the repo, written before the
analysis was finalized. The goal: anyone reading the final
notebook should be able to challenge the methodology by pointing
at a specific decision, not by guessing.
| ADR | Decision | Rationale |
|---|---|---|
| ADR-001 | Kaplan-Meier over simple closure rates | Closure-rate framing ignores right-censoring. KM handles it correctly and gives a survival probability at every time point, not a single yes/no. |
| ADR-002 | 행정안전부 일반음식점 over 골목상권 | Initial pick 골목상권 (OA-15577) turned out to be aggregate-level quarterly counts, not store-level. Pivoted to the 행정안전부 license dataset — the only public source with per-store 인허가일자 + 폐업일자. |
| ADR-003 | Jupyter notebook over Streamlit dashboard | The deliverable is the analytical narrative — explaining methodology, interpreting results, discussing limitations. A dashboard would have hidden the reasoning. |
| ADR-004 | 100K random sample for Cox PH; full 528K for KM & log-rank |
KM and log-rank are non-parametric and scale well. Cox PH
matrix operations OOM'd on 528K. 100K is large enough for
stable estimates — all 14 covariates still significant at
p < 0.005.
|
| ADR-005 | cp949 encoding + chunked reads | Korean government CSVs use cp949 (EUC-KR), not UTF-8. The 658MB / 2.27M-row file is read in 100K-row chunks, re-saved as UTF-8, peak memory under 500MB. |
Pipeline
2.27M raw nationwide records → 528,487 clean Seoul records, with six quality checks logged and verified.
The 658MB raw CSV from data.go.kr lands in cp949 encoding with 2,271,210 rows across all of South Korea. Filtering to Seoul drops it to 534,812; six quality checks then remove 6,325 problem rows (389 with license dates before 1970, 27 closures missing close dates, 2,156 missing district codes, plus duplicates and negative durations). What survives is 528,487 records — 408,336 closed, 120,151 still operating — covering all 25 Seoul districts.
| Stage | Rows | Notes |
|---|---|---|
| Raw CSV (nationwide) | 2,271,210 | 658 MB, cp949 encoding, read in 100K-row chunks |
| Filtered to Seoul | 534,812 | All 25 districts represented |
| After 6 QC checks | 528,487 | Removed 1.2% — pre-1970, missing fields, negative durations |
| — closed | 408,336 | 77.3% — used as event observations |
| — still open | 120,151 | 22.7% — right-censored at observation date |
Verification step before any analysis ran: all 25 districts
present in the cleaned dataset, ~99% of closed stores had a close
date (only 27 missing), zero negative durations, duration
distribution looked plausible (median 59.5 months, p10 at 9.4
months). All of this is logged in the project's
03-JOURNAL.md as Phase-1 verification.
Findings
Three results that wouldn't appear in a naive closure-rate analysis: location dominates cuisine, COVID hit a measurable cohort, and survival is front-loaded.
1. Headline survival rates
The corrected (Kaplan-Meier) survival rates. The 5-year point estimate of 55.9% is roughly 22 percentage points higher than the naive "% closed" reporting would suggest.
| Time point | Survival rate |
|---|---|
| 1 year | 89.0% |
| 3 years | 69.4% |
| 5 years | 55.9% |
| 10 years | 34.6% |
2. Where you open matters more than what you cook
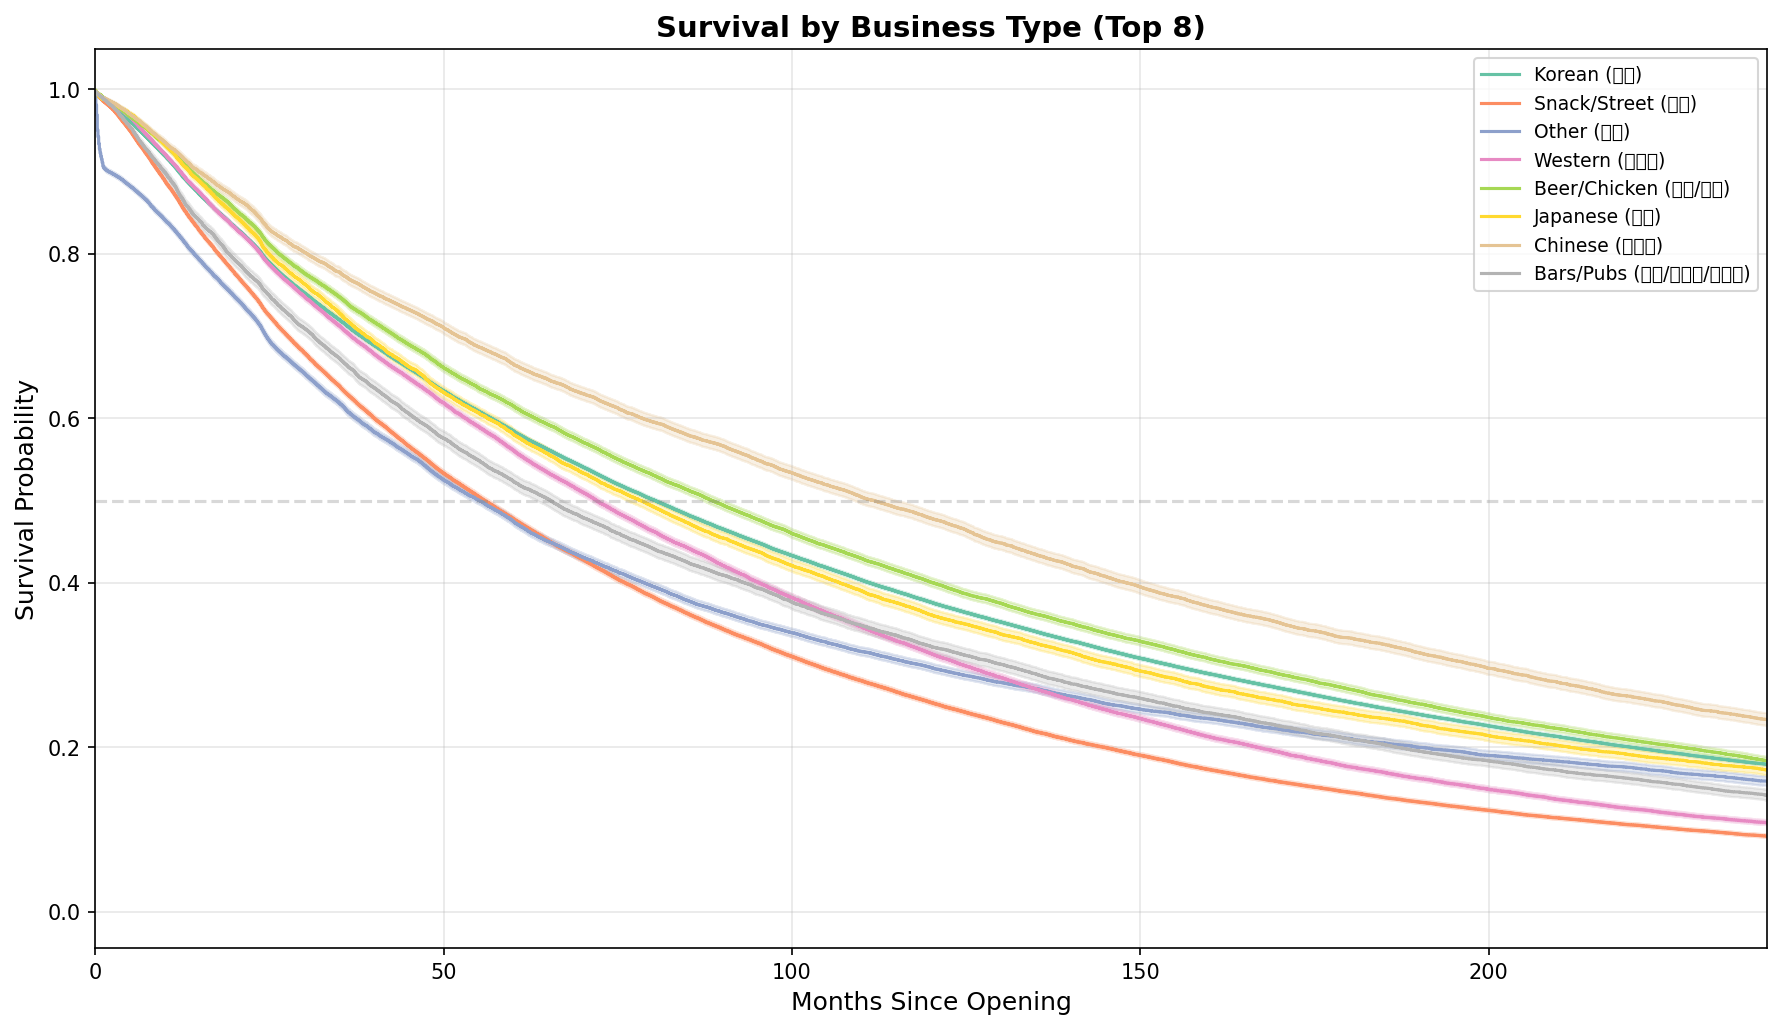
The median-survival gap across districts (5.3 years) is larger than the gap across cuisine types (4.6 years). City-center districts with tourism and office density (Jongno, Jung-gu) outperform residential suburbs (Yangcheon).
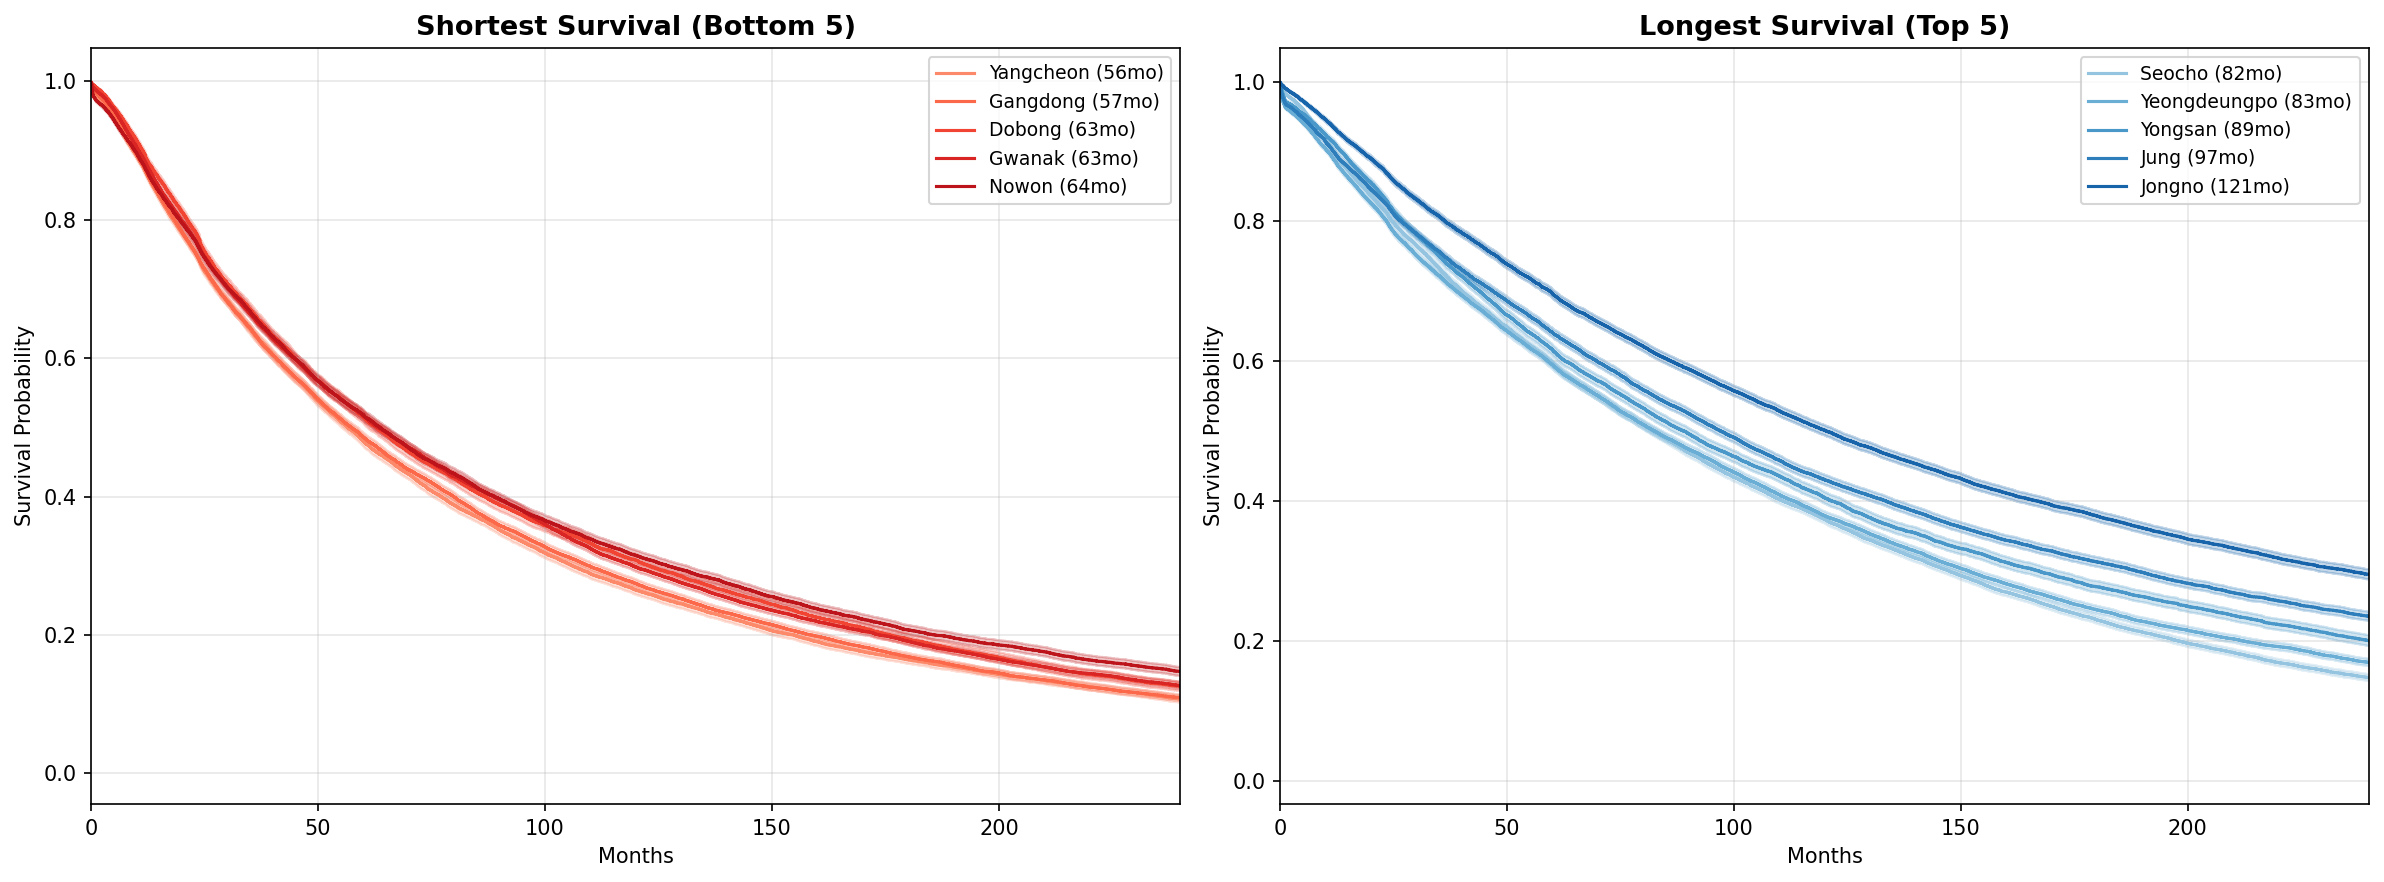
p < 0.001.
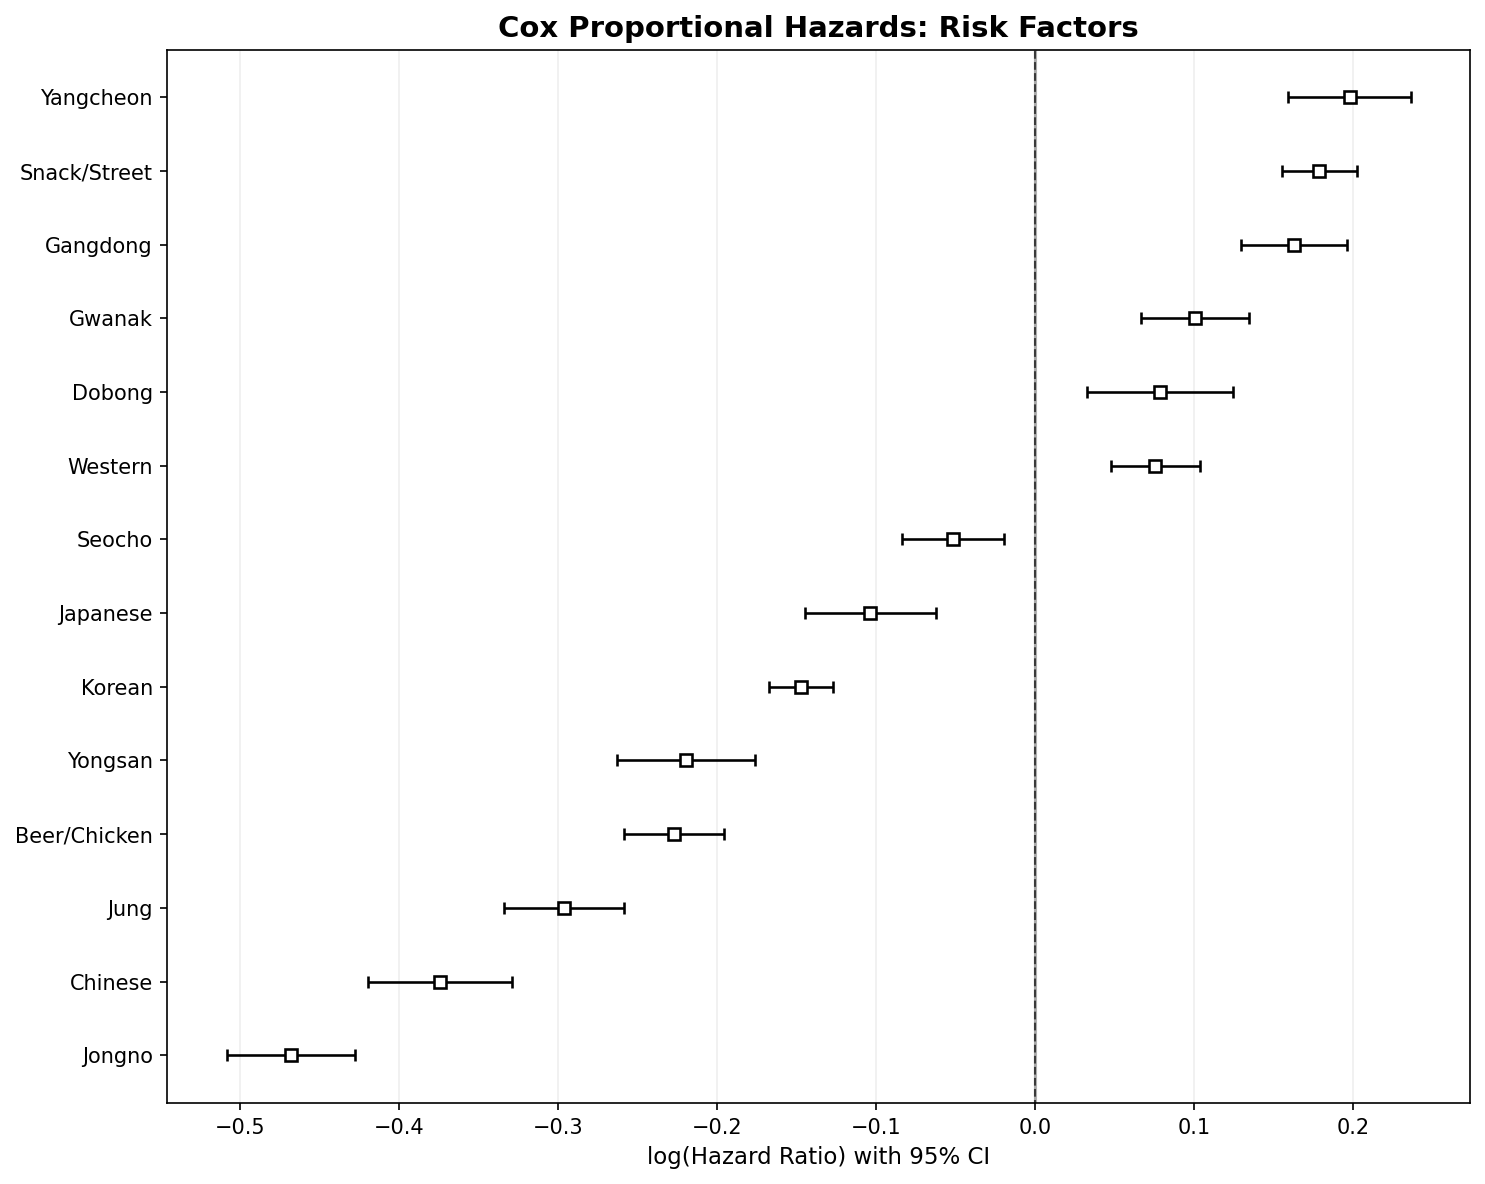
3. Cox PH: location effects are large and significant
Cox proportional hazards regression on a 100K sample, 14
covariates, all significant at p < 0.005. Jongno-gu
is the most protective location (HR = 0.63, i.e. 37% lower
closure risk than the baseline). Yangcheon-gu carries the highest
risk (HR = 1.22).
4. The COVID cohort — an unplanned discovery
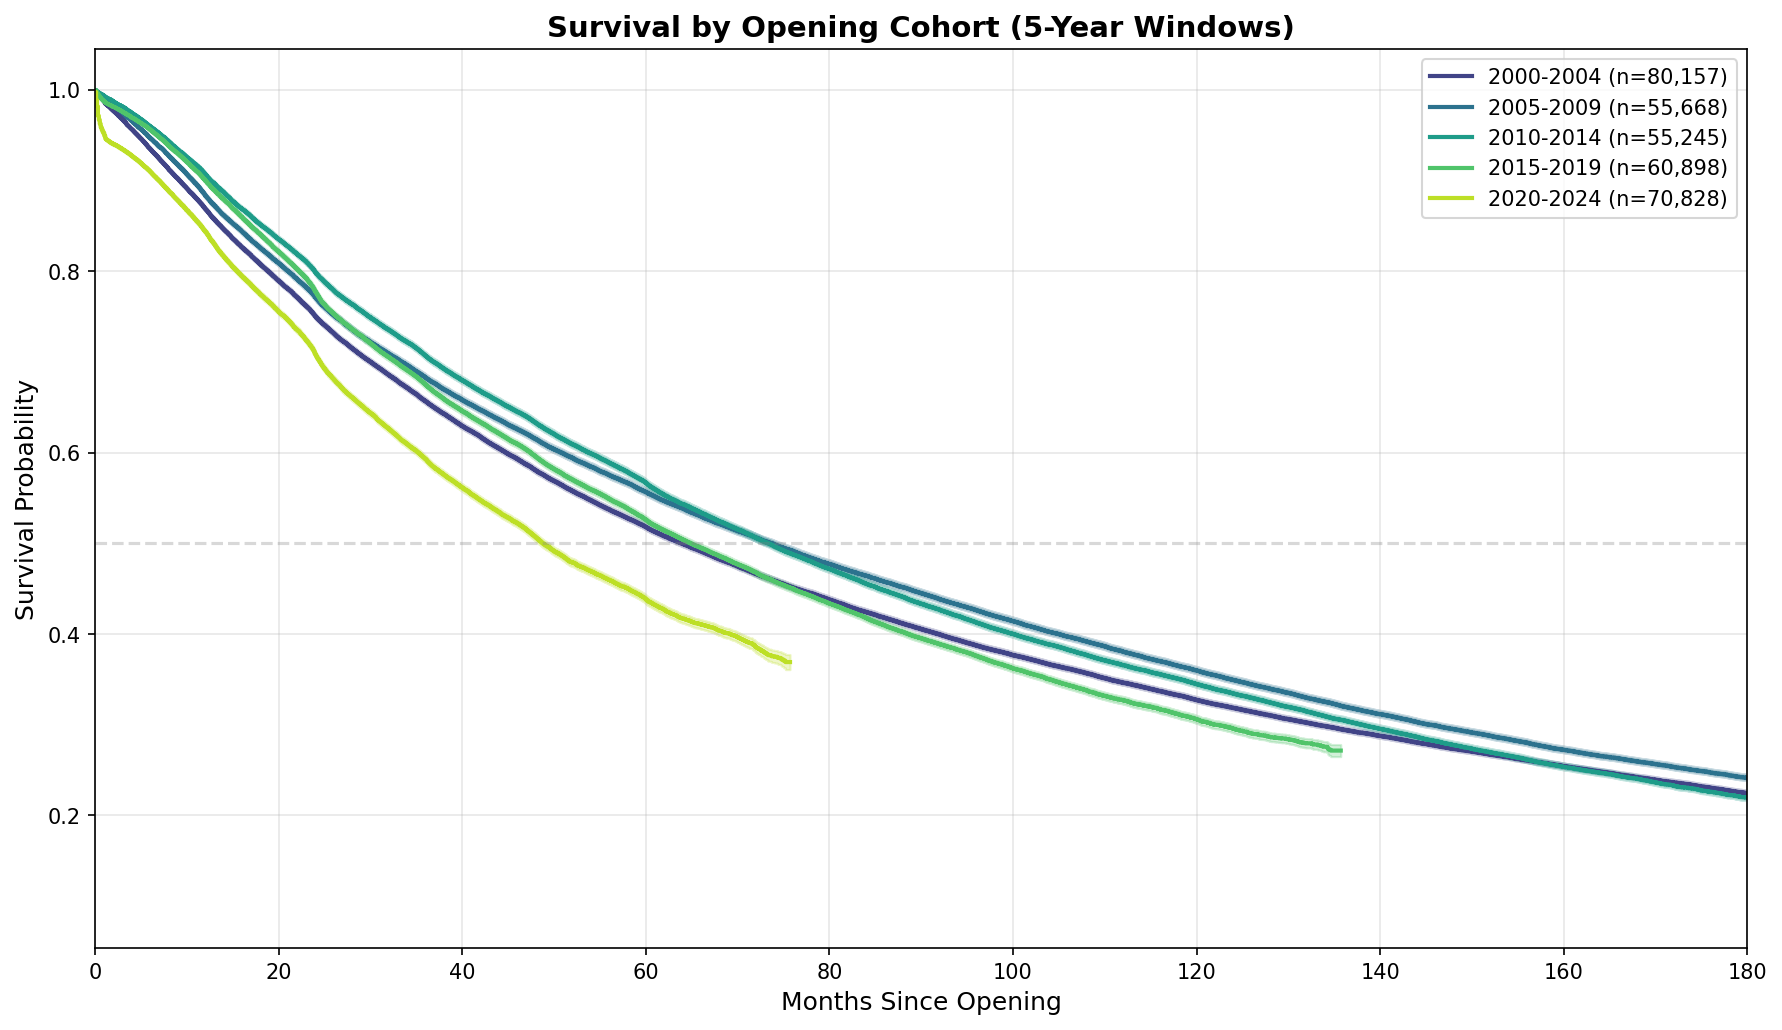
Cohort analysis wasn't part of the original plan. It was added in Phase 3 to answer "are restaurants surviving longer or shorter than 5 years ago?" The result was sharper than expected.
Limitations
What this dataset and methodology can't tell us — written explicitly so the analysis can be defended on its own terms.
- License date is a proxy for opening date. 인허가일자 is when the license was issued; actual opening can lag by weeks or months. Means the very-early-life curve is slightly conservative.
- No covariates beyond location and type. The license data has no revenue, no rent, no foot traffic, no nearby competition. That's why the Cox PH concordance is 0.55 — significant signal, but most variance is unexplained by what the data captures.
- Pre-2000 records may have survivorship bias. Older restaurants that closed long ago are less likely to have been digitized — early-period survival is slightly inflated.
- Competing risks not modeled. A restaurant closing and reopening under a new name shows up as two short-lived restaurants. The current model can't distinguish that from a true exit.
Lessons Learned
Picking the right statistical tool before running anything was worth more than any modeling afterward.
Tool choice is upstream of analysis. If I'd reported "% closed," I would have stated a ~77% failure rate — dramatic, cited, and statistically wrong, because it counts 120K still-being-observed restaurants as failures. The Kaplan-Meier estimate of 55.9% at five years is both more accurate and more useful for anyone actually deciding whether to open a restaurant. The lesson generalizes: picking the right tool for the right question is upstream of all the analytical work that follows.
Verify a dataset before designing around it. The data pivot from 골목상권 → 행정안전부 was avoidable. I'd planned the full project around 골목상권 (OA-15577) and didn't realize until I'd downloaded it that it was aggregate-level — quarterly counts of stores per commercial area, not individual store records. The 행정안전부 license data was the correct source from the start. The cost was a day of rework; the lesson is to inspect schemas before writing analysis plans.
What I'd do differently next time. Run the Cox PH on the full 528K dataset using chunked or out-of-core methods rather than falling back to a 100K random sample. The sample is statistically defensible, but it's a workaround I'd want to remove if I revisited this. I'd also test the proportional hazards assumption explicitly — location might matter more in the first 2 years than it does after — and consider modeling competing risks so a "closed-and-rebranded" restaurant doesn't get counted as two short-lived ones.